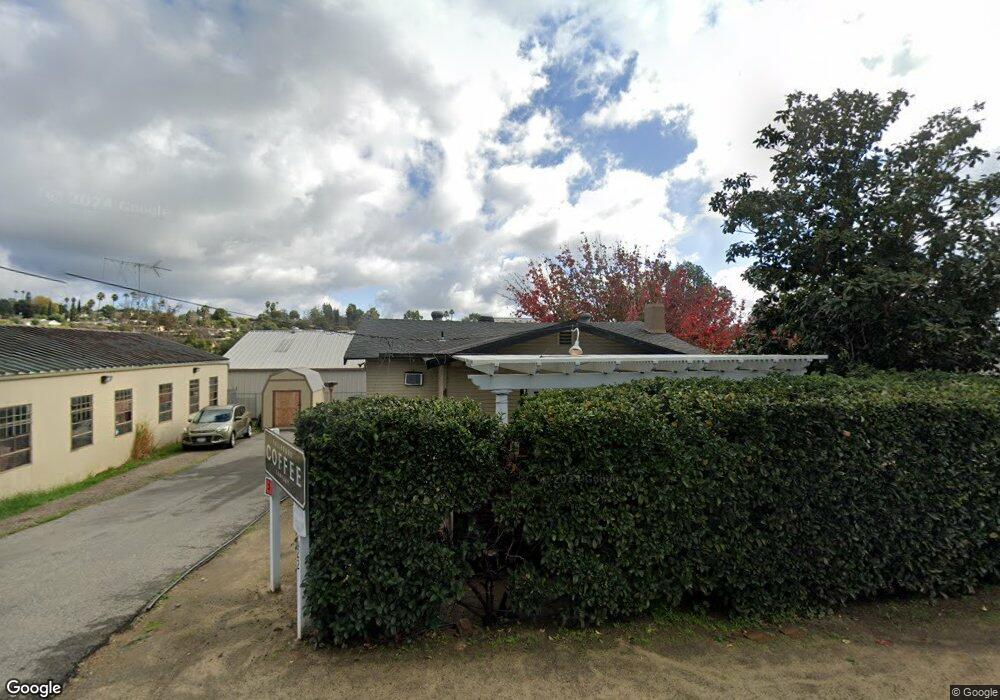
622 S Mission Rd Fallbrook, CA 92028
Estimated Value: $629,577
2
Beds
1
Bath
1,044
Sq Ft
$603/Sq Ft
Est. Value
About This Home
This home is located at 622 S Mission Rd, Fallbrook, CA 92028 and is currently estimated at $629,577, approximately $603 per square foot. 622 S Mission Rd is a home located in San Diego County with nearby schools including Fallbrook STEM Academy, James E. Potter Intermediate School, and Fallbrook High School.
Ownership History
Date
Name
Owned For
Owner Type
Purchase Details
Closed on
Feb 2, 2012
Sold by
Wilterding John David and Wilterding Annelle C
Bought by
Sterbenk John A and Sterbenk Leslie A
Current Estimated Value
Purchase Details
Closed on
Jan 23, 2007
Sold by
Wilterding John David and Wilterding Annelle C
Bought by
Wilterding John David and Wilterding Annelle C
Purchase Details
Closed on
Aug 11, 2005
Sold by
Wilterding David
Bought by
Wilterding David
Purchase Details
Closed on
May 30, 1997
Sold by
Mccutcheon Rice Partnership
Bought by
Wilterding Minta D
Home Financials for this Owner
Home Financials are based on the most recent Mortgage that was taken out on this home.
Original Mortgage
$100,000
Interest Rate
7.98%
Mortgage Type
Purchase Money Mortgage
Purchase Details
Closed on
Jan 19, 1995
Sold by
Rice Sharon
Bought by
Rice Leo E and Rice Sharon J
Create a Home Valuation Report for This Property
The Home Valuation Report is an in-depth analysis detailing your home's value as well as a comparison with similar homes in the area
Home Values in the Area
Average Home Value in this Area
Purchase History
| Date | Buyer | Sale Price | Title Company |
|---|---|---|---|
| Sterbenk John A | $225,000 | First American Title Company | |
| Wilterding John David | -- | None Available | |
| Wilterding John David | -- | None Available | |
| Wilterding David | -- | -- | |
| Wilterding Minta D | $83,500 | First American Title | |
| Wilterding Minda D | $166,500 | First American Title | |
| Mccutcheon Rice Partnership | -- | First American Title | |
| Mccutcheon Rice Partnership | -- | First American Title | |
| Rice Leo E | -- | -- |
Source: Public Records
Mortgage History
| Date | Status | Borrower | Loan Amount |
|---|---|---|---|
| Previous Owner | Wilterding Minda D | $100,000 |
Source: Public Records
Tax History Compared to Growth
Tax History
| Year | Tax Paid | Tax Assessment Tax Assessment Total Assessment is a certain percentage of the fair market value that is determined by local assessors to be the total taxable value of land and additions on the property. | Land | Improvement |
|---|---|---|---|---|
| 2025 | $2,998 | $282,599 | $169,562 | $113,037 |
| 2024 | $2,998 | $277,059 | $166,238 | $110,821 |
| 2023 | $2,916 | $271,628 | $162,979 | $108,649 |
| 2022 | $2,914 | $266,303 | $159,784 | $106,519 |
| 2021 | $2,834 | $261,082 | $156,651 | $104,431 |
| 2020 | $2,865 | $258,406 | $155,045 | $103,361 |
| 2019 | $2,822 | $253,340 | $152,005 | $101,335 |
| 2018 | $2,780 | $248,374 | $149,025 | $99,349 |
| 2017 | $2,726 | $243,504 | $146,103 | $97,401 |
| 2016 | $2,714 | $238,731 | $143,239 | $95,492 |
| 2015 | $2,620 | $235,146 | $141,088 | $94,058 |
| 2014 | $2,572 | $230,541 | $138,325 | $92,216 |
Source: Public Records
Map
Nearby Homes
- 522 S Pico Ave
- 212 S Wisconsin St
- 720 W Fig St
- 435 W Hawthorne St
- 1206 Old Stage Rd
- 508 Village View Place
- 503 Potter St
- 324 Shady Glen Dr
- 710 Ceramic Ln
- 139 Almond St Unit 41
- 519 Minnesota St
- 251 Royal Glen Dr
- 425 E Dougherty St
- 1455 Alturas Rd Unit 55
- 203 Rhesa Ln
- 678 Robby Way
- 868 E Alvarado St Unit 46
- 831 N Orange Ave
- 1018 Morro Rd
- 705 Old Bridge Rd
- 35345 Brown Galloway Ln
- Lot 5 Janemar Remainder Parcel
- 133 W Fallbrook St
- 00 Pico Ave Ave S
- 00 Pico Ave S
- S Pico
- 514 S Pico Ave
- 615 S Main Ave
- 408 W Fallbrook St Unit 10
- 615 615 Main Ave Ave
- 124 W Beech St
- 420 W Fallbrook St Unit 22
- 485 Meadowood St
- 513 Meadowood St
- 118 W Beech St Unit 20
- 0 S Wisconsin St
- 748 S Wisconsin St
- 507 S Main Ave
- 507 S Main Ave Unit A
- 507 507 S Main St