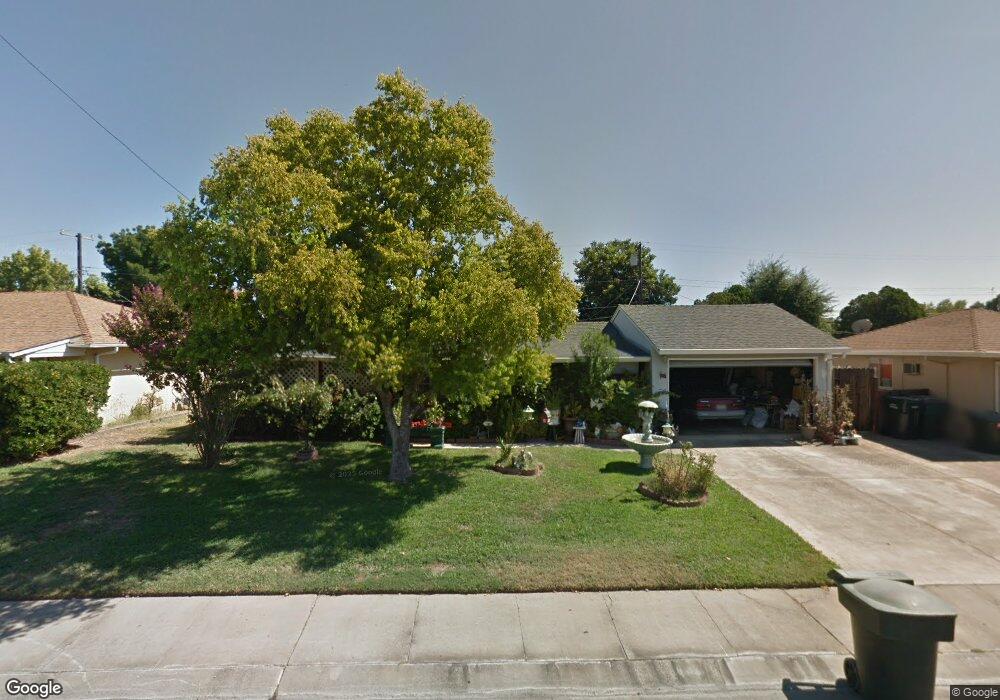
6220 Fairfax Way Unit CAL North Highlands, CA 95660
Estimated Value: $328,000 - $416,000
3
Beds
1
Bath
1,051
Sq Ft
$362/Sq Ft
Est. Value
About This Home
This home is located at 6220 Fairfax Way Unit CAL, North Highlands, CA 95660 and is currently estimated at $380,077, approximately $361 per square foot. 6220 Fairfax Way Unit CAL is a home located in Sacramento County with nearby schools including Kohler Elementary School, Highlands High School, and Community Outreach Academy Elementary School.
Ownership History
Date
Name
Owned For
Owner Type
Purchase Details
Closed on
Mar 6, 2023
Sold by
Botello Alondra Yuritzi Gaona
Bought by
Botello Alondra Yuritzi Gaon
Current Estimated Value
Purchase Details
Closed on
Oct 6, 2022
Sold by
Breckenridge Property Fund 2016 Llc
Bought by
Botello Alondra Yuritzi Gaon and Esqueda Ismael
Home Financials for this Owner
Home Financials are based on the most recent Mortgage that was taken out on this home.
Original Mortgage
$371,525
Interest Rate
6.92%
Mortgage Type
New Conventional
Purchase Details
Closed on
Jan 27, 2022
Sold by
Trustee Corps
Bought by
Breckenridge Property Fund 2016 Llc
Create a Home Valuation Report for This Property
The Home Valuation Report is an in-depth analysis detailing your home's value as well as a comparison with similar homes in the area
Home Values in the Area
Average Home Value in this Area
Purchase History
| Date | Buyer | Sale Price | Title Company |
|---|---|---|---|
| Botello Alondra Yuritzi Gaon | -- | -- | |
| Botello Alondra Yuritzi Gaon | $385,000 | Fidelity National Title | |
| Breckenridge Property Fund 2016 Llc | $318,632 | None Listed On Document | |
| Breckenridge Property Fund 201 | $318,632 | None Listed On Document |
Source: Public Records
Mortgage History
| Date | Status | Borrower | Loan Amount |
|---|---|---|---|
| Previous Owner | Botello Alondra Yuritzi Gaon | $371,525 |
Source: Public Records
Tax History Compared to Growth
Tax History
| Year | Tax Paid | Tax Assessment Tax Assessment Total Assessment is a certain percentage of the fair market value that is determined by local assessors to be the total taxable value of land and additions on the property. | Land | Improvement |
|---|---|---|---|---|
| 2025 | $4,519 | $400,554 | $93,636 | $306,918 |
| 2024 | $4,519 | $392,700 | $91,800 | $300,900 |
| 2023 | $4,551 | $385,000 | $90,000 | $295,000 |
| 2022 | $1,472 | $135,190 | $34,656 | $100,534 |
| 2021 | $2,876 | $132,540 | $33,977 | $98,563 |
| 2020 | $2,449 | $131,182 | $33,629 | $97,553 |
| 2019 | $1,433 | $128,611 | $32,970 | $95,641 |
| 2018 | $2,592 | $126,090 | $32,324 | $93,766 |
| 2017 | $1,394 | $123,619 | $31,691 | $91,928 |
| 2016 | $1,393 | $121,196 | $31,070 | $90,126 |
| 2015 | $1,308 | $119,377 | $30,604 | $88,773 |
| 2014 | $1,333 | $117,040 | $30,005 | $87,035 |
Source: Public Records
Map
Nearby Homes
- 3701 Bolivar Ave
- 6308 Morazan St
- 6416 Grattan Way
- 6233 Watt Ave
- 6309 Claussen Way
- 6449 Larry Way
- 6540 Channing Dr
- 3824 Karl Dr
- 5851 Larry Way
- 4129 Glascow Dr
- 4045 Heather Hill Way
- 5708 San Marcos Way
- 6088 Georgia Dr
- 5704 San Marcos Way
- 6700 Cantel Way
- 3900 Fargo Way
- 6609 Medora Dr
- 6108 Georgia Dr
- 5832 San Ardo Way
- 3223 I St
- 6220 Fairfax Way
- 6216 Fairfax Way
- 6224 Fairfax Way
- 3752 Bolivar Ave
- 3756 Bolivar Ave
- 3748 Bolivar Ave
- 6212 Fairfax Way
- 6221 Fairfax Way
- 6217 Fairfax Way
- 6225 Fairfax Way
- 3760 Bolivar Ave
- 3744 Bolivar Ave
- 6213 Fairfax Way
- 6229 Fairfax Way
- 6208 Fairfax Way
- 6236 Fairfax Way
- 3764 Bolivar Ave
- 3740 Bolivar Ave
- 6220 Melrose Dr