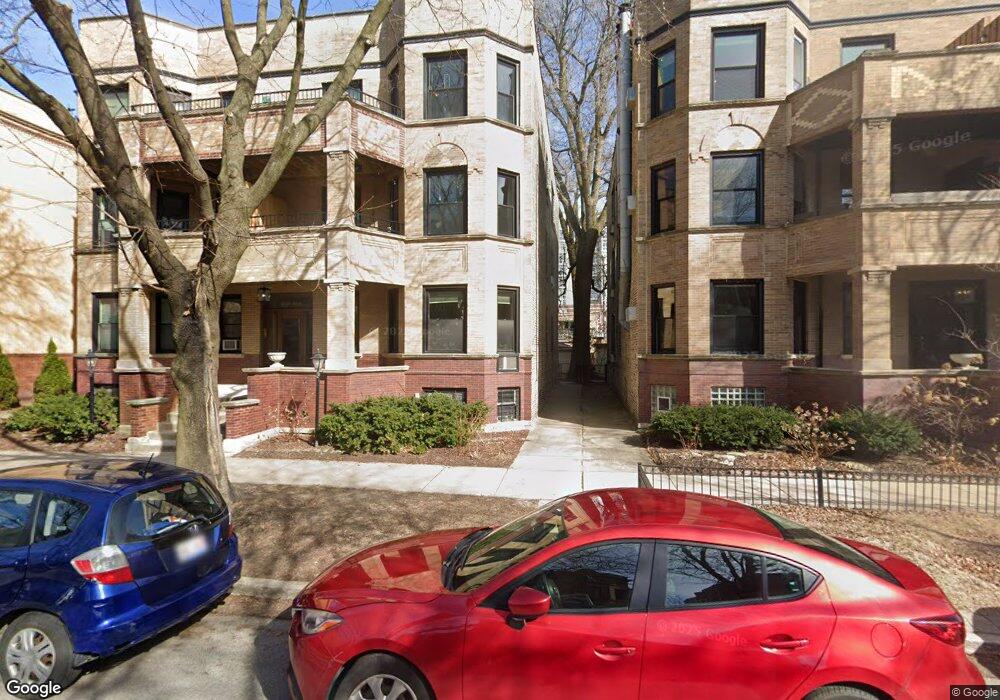
6221 N Magnolia Ave Unit 1N Chicago, IL 60660
Edgewater NeighborhoodEstimated Value: $374,000 - $446,000
2
Beds
--
Bath
11,424
Sq Ft
$35/Sq Ft
Est. Value
About This Home
This home is located at 6221 N Magnolia Ave Unit 1N, Chicago, IL 60660 and is currently estimated at $395,501, approximately $34 per square foot. 6221 N Magnolia Ave Unit 1N is a home located in Cook County with nearby schools including Hayt Elementary School, Senn High School, and Northside Catholic Academy.
Ownership History
Date
Name
Owned For
Owner Type
Purchase Details
Closed on
Oct 7, 2025
Sold by
William Robert Charles Declaration Of Tr and Charles Holly Charlene
Bought by
Badger Rachel Gene and Emig Anne-Lise
Current Estimated Value
Home Financials for this Owner
Home Financials are based on the most recent Mortgage that was taken out on this home.
Original Mortgage
$335,000
Outstanding Balance
$335,000
Interest Rate
5.88%
Mortgage Type
New Conventional
Estimated Equity
$60,501
Purchase Details
Closed on
Mar 22, 2016
Sold by
Holly Charles William R and Holly Charles
Bought by
Declara Charles William Robert and William Robert Charles Declaration O
Purchase Details
Closed on
Aug 13, 2003
Sold by
Lemmer Lorraine N
Bought by
Holly Charles William R and Holly Charles
Home Financials for this Owner
Home Financials are based on the most recent Mortgage that was taken out on this home.
Original Mortgage
$204,000
Interest Rate
4.12%
Mortgage Type
Purchase Money Mortgage
Create a Home Valuation Report for This Property
The Home Valuation Report is an in-depth analysis detailing your home's value as well as a comparison with similar homes in the area
Home Values in the Area
Average Home Value in this Area
Purchase History
| Date | Buyer | Sale Price | Title Company |
|---|---|---|---|
| Badger Rachel Gene | $405,000 | None Listed On Document | |
| Declara Charles William Robert | -- | Attorney | |
| Holly Charles William R | $255,000 | Cti |
Source: Public Records
Mortgage History
| Date | Status | Borrower | Loan Amount |
|---|---|---|---|
| Open | Badger Rachel Gene | $335,000 | |
| Previous Owner | Holly Charles William R | $204,000 |
Source: Public Records
Tax History Compared to Growth
Tax History
| Year | Tax Paid | Tax Assessment Tax Assessment Total Assessment is a certain percentage of the fair market value that is determined by local assessors to be the total taxable value of land and additions on the property. | Land | Improvement |
|---|---|---|---|---|
| 2024 | $4,437 | $32,648 | $12,438 | $20,210 |
| 2023 | $4,287 | $27,000 | $10,000 | $17,000 |
| 2022 | $4,287 | $27,000 | $10,000 | $17,000 |
| 2021 | $4,224 | $26,999 | $10,000 | $16,999 |
| 2020 | $5,489 | $30,225 | $5,750 | $24,475 |
| 2019 | $5,479 | $33,443 | $5,750 | $27,693 |
| 2018 | $5,385 | $33,443 | $5,750 | $27,693 |
| 2017 | $4,470 | $26,840 | $5,000 | $21,840 |
| 2016 | $4,518 | $26,840 | $5,000 | $21,840 |
| 2015 | $4,094 | $26,840 | $5,000 | $21,840 |
| 2014 | $3,920 | $25,533 | $3,812 | $21,721 |
| 2013 | $3,824 | $25,533 | $3,812 | $21,721 |
Source: Public Records
Map
Nearby Homes
- 1234 W Granville Ave
- 1221 W Granville Ave Unit 2B
- 1243 W Rosemont Ave Unit 12433
- 1265 W Granville Ave Unit 3
- 6316 N Magnolia Ave
- 6328 N Magnolia Ave
- 6335 N Magnolia Ave Unit G
- 1331 W Granville Ave
- 6150 N Kenmore Ave Unit 15B
- 1457 W Rosemont Ave Unit G
- 6300 N Sheridan Rd Unit 517
- 6300 N Sheridan Rd Unit 710
- 6300 N Sheridan Rd Unit 406
- 6300 N Sheridan Rd Unit 811
- 6342 N Sheridan Rd Unit 5B
- 6157 N Sheridan Rd Unit 25A
- 6157 N Sheridan Rd Unit 3M
- 6157 N Sheridan Rd Unit 5G
- 6157 N Sheridan Rd Unit 19G
- 6118 N Sheridan Rd Unit 1003
- 6221 N Magnolia Ave Unit 3S
- 6221 N Magnolia Ave Unit 2S
- 6221 N Magnolia Ave Unit 2N
- 6221 N Magnolia Ave Unit 1S
- 6221 N Magnolia Ave Unit 3N
- 6223 N Magnolia Ave Unit 2N
- 6223 N Magnolia Ave Unit 1N
- 6229 N Magnolia Ave
- 6219 N Magnolia Ave Unit 2
- 6219 N Magnolia Ave Unit 3
- 6219 N Magnolia Ave Unit 1
- 6217 N Magnolia Ave Unit 1
- 6217 N Magnolia Ave Unit 2
- 6217 N Magnolia Ave Unit 3
- 6217 N Magnolia Ave Unit 1S
- 6217 N Magnolia Ave Unit 2S
- 6231 N Magnolia Ave
- 6233 N Magnolia Ave
- 6220 N Broadway St
- 6237 N Magnolia Ave