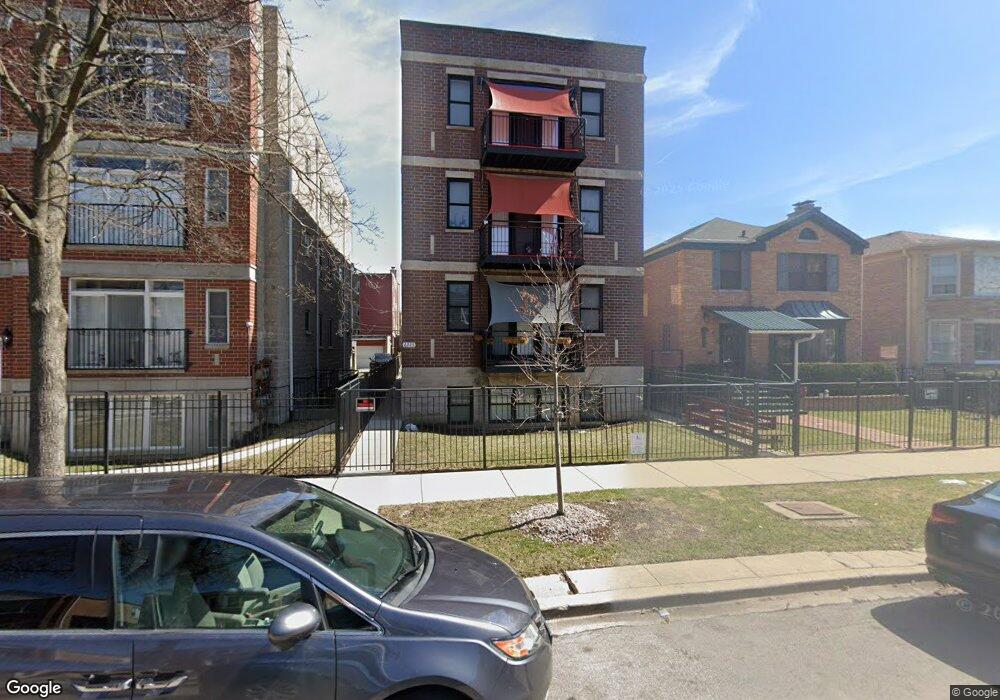
6225 N Richmond St Unit 2E Chicago, IL 60659
West Ridge NeighborhoodEstimated Value: $295,000 - $361,000
3
Beds
3
Baths
4,809
Sq Ft
$66/Sq Ft
Est. Value
About This Home
This home is located at 6225 N Richmond St Unit 2E, Chicago, IL 60659 and is currently estimated at $319,341, approximately $66 per square foot. 6225 N Richmond St Unit 2E is a home located in Cook County with nearby schools including West Ridge Elementary School, Mather High School, and Yeshivas Tiferes Tzvi Academy.
Ownership History
Date
Name
Owned For
Owner Type
Purchase Details
Closed on
Aug 23, 2007
Sold by
Anton Marius
Bought by
Ratsaphong Viraphong and Laosunthareeya Aveewan
Current Estimated Value
Home Financials for this Owner
Home Financials are based on the most recent Mortgage that was taken out on this home.
Original Mortgage
$297,350
Outstanding Balance
$189,323
Interest Rate
6.77%
Mortgage Type
New Conventional
Estimated Equity
$130,018
Purchase Details
Closed on
May 23, 2006
Sold by
Crain Northwest Construction Inc
Bought by
Anton Marius
Home Financials for this Owner
Home Financials are based on the most recent Mortgage that was taken out on this home.
Original Mortgage
$295,920
Interest Rate
6.66%
Mortgage Type
Fannie Mae Freddie Mac
Create a Home Valuation Report for This Property
The Home Valuation Report is an in-depth analysis detailing your home's value as well as a comparison with similar homes in the area
Home Values in the Area
Average Home Value in this Area
Purchase History
| Date | Buyer | Sale Price | Title Company |
|---|---|---|---|
| Ratsaphong Viraphong | $313,000 | Chicago Title Insurance Co | |
| Anton Marius | $370,000 | Chicago Title Insurance Co |
Source: Public Records
Mortgage History
| Date | Status | Borrower | Loan Amount |
|---|---|---|---|
| Open | Ratsaphong Viraphong | $297,350 | |
| Previous Owner | Anton Marius | $295,920 |
Source: Public Records
Tax History Compared to Growth
Tax History
| Year | Tax Paid | Tax Assessment Tax Assessment Total Assessment is a certain percentage of the fair market value that is determined by local assessors to be the total taxable value of land and additions on the property. | Land | Improvement |
|---|---|---|---|---|
| 2024 | $3,731 | $30,100 | $3,861 | $26,239 |
| 2023 | $3,616 | $21,000 | $3,130 | $17,870 |
| 2022 | $3,616 | $21,000 | $3,130 | $17,870 |
| 2021 | $3,553 | $20,999 | $3,130 | $17,869 |
| 2020 | $3,314 | $17,978 | $1,878 | $16,100 |
| 2019 | $3,367 | $20,188 | $1,878 | $18,310 |
| 2018 | $3,309 | $20,188 | $1,878 | $18,310 |
| 2017 | $3,979 | $21,857 | $1,669 | $20,188 |
| 2016 | $5,227 | $28,595 | $1,669 | $26,926 |
| 2015 | $4,759 | $28,595 | $1,669 | $26,926 |
| 2014 | $4,439 | $26,491 | $1,565 | $24,926 |
| 2013 | $4,340 | $26,491 | $1,565 | $24,926 |
Source: Public Records
Map
Nearby Homes
- 6226 N Mozart St Unit 2N
- 6214 N Mozart St Unit 3E
- 6212 N Sacramento Ave
- 6235 N Mozart St
- 6210 N Albany Ave
- 6400 N Sacramento Ave Unit 205
- 6312 N Fairfield Ave Unit 3B
- 6310 N Troy St
- 6215 N Washtenaw Ave
- 6508 N Richmond St Unit 1D
- 6451 N California Ave Unit 2
- 6040 N Troy St Unit 306
- 6457 N California Ave Unit 3
- 6504 N Whipple St
- 6215 N Talman Ave
- 6308 N Kedzie Ave Unit 2W
- 6307 N Talman Ave
- 6539 N Sacramento Ave
- 6414 N Rockwell St
- 6418 N Rockwell St
- 6225 N Richmond St Unit 1E
- 6225 N Richmond St Unit 1W
- 6225 N Richmond St Unit 2W
- 6219 N Richmond St
- 6229 N Richmond St Unit 4S
- 6229 N Richmond St Unit 4N
- 6229 N Richmond St Unit 3S
- 6229 N Richmond St Unit 3N
- 6229 N Richmond St Unit 2S
- 6229 N Richmond St Unit 2N
- 6229 N Richmond St Unit 1S
- 6229 N Richmond St Unit 1N
- 6229 N Richmond St
- 6229 N Richmond St Unit 3B
- 6229 N Richmond St Unit 3A
- 6229 N Richmond St Unit 2B
- 6229 N Richmond St Unit 2A
- 6229 N Richmond St Unit 1D
- 6229 N Richmond St Unit 1C
- 6229 N Richmond St Unit 1B