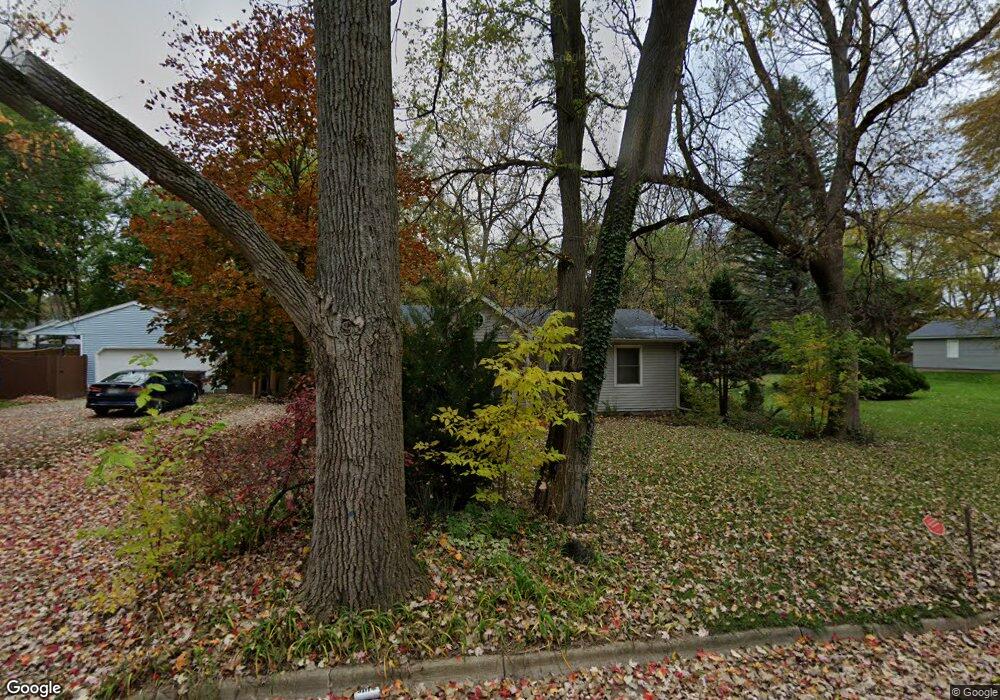
6228 Shreve St Lansing, MI 48911
Southern Lansing NeighborhoodEstimated Value: $109,000 - $124,000
--
Bed
--
Bath
816
Sq Ft
$142/Sq Ft
Est. Value
About This Home
This home is located at 6228 Shreve St, Lansing, MI 48911 and is currently estimated at $116,114, approximately $142 per square foot. 6228 Shreve St is a home located in Ingham County with nearby schools including Reo Elementary School, Attwood School, and Everett High School.
Ownership History
Date
Name
Owned For
Owner Type
Purchase Details
Closed on
Apr 15, 2019
Sold by
The Estate Of Larry Calvin Hewitt
Bought by
Rios Joshua A
Current Estimated Value
Home Financials for this Owner
Home Financials are based on the most recent Mortgage that was taken out on this home.
Original Mortgage
$64,754
Outstanding Balance
$57,045
Interest Rate
4.4%
Mortgage Type
FHA
Estimated Equity
$59,069
Purchase Details
Closed on
Jun 20, 2002
Sold by
Chapman Mary L
Bought by
Hewitt Larry C
Home Financials for this Owner
Home Financials are based on the most recent Mortgage that was taken out on this home.
Original Mortgage
$71,250
Interest Rate
6.79%
Mortgage Type
Purchase Money Mortgage
Purchase Details
Closed on
Oct 17, 1997
Sold by
Fuller William R and Fuller Carla R
Bought by
Chapman Mary L
Create a Home Valuation Report for This Property
The Home Valuation Report is an in-depth analysis detailing your home's value as well as a comparison with similar homes in the area
Home Values in the Area
Average Home Value in this Area
Purchase History
| Date | Buyer | Sale Price | Title Company |
|---|---|---|---|
| Rios Joshua A | $65,950 | Ata National Title Group Llc | |
| Hewitt Larry C | $75,000 | Chicago Title | |
| Chapman Mary L | $33,900 | -- |
Source: Public Records
Mortgage History
| Date | Status | Borrower | Loan Amount |
|---|---|---|---|
| Open | Rios Joshua A | $64,754 | |
| Previous Owner | Hewitt Larry C | $71,250 |
Source: Public Records
Tax History Compared to Growth
Tax History
| Year | Tax Paid | Tax Assessment Tax Assessment Total Assessment is a certain percentage of the fair market value that is determined by local assessors to be the total taxable value of land and additions on the property. | Land | Improvement |
|---|---|---|---|---|
| 2025 | $2,402 | $49,500 | $8,200 | $41,300 |
| 2024 | $19 | $38,500 | $8,200 | $30,300 |
| 2023 | $2,253 | $34,300 | $8,200 | $26,100 |
| 2022 | $2,046 | $33,000 | $8,300 | $24,700 |
| 2021 | $2,004 | $33,100 | $7,400 | $25,700 |
| 2020 | $1,991 | $31,400 | $7,400 | $24,000 |
| 2019 | $1,541 | $27,900 | $7,400 | $20,500 |
| 2018 | $1,447 | $24,000 | $7,400 | $16,600 |
| 2017 | $1,384 | $24,000 | $7,400 | $16,600 |
| 2016 | $1,327 | $23,700 | $7,400 | $16,300 |
| 2015 | $1,327 | $23,200 | $14,740 | $8,460 |
| 2014 | $1,327 | $22,900 | $17,563 | $5,337 |
Source: Public Records
Map
Nearby Homes
- 1119 W Miller Rd
- 6270 S Washington Ave
- 6037 Hughes Rd
- 6421 S Washington Ave
- 1020 R G Curtiss Ave
- 5750 Ashley Dr
- 2626 Little Hickory Dr
- 6444 Sommerset Rd
- 5902 Hilliard Rd
- 5838 S Martin Luther King Junior Blvd
- 1014 W Northrup St
- 6030 Piper Ave
- 6029 Ellendale Dr
- 218 Raritan Rd
- 6429 Rosedale Rd
- 6820 Richard Rd
- 6819 Richard Rd
- 5636 Ellendale Dr
- 5727 Annapolis Dr
- 825 Ferley St