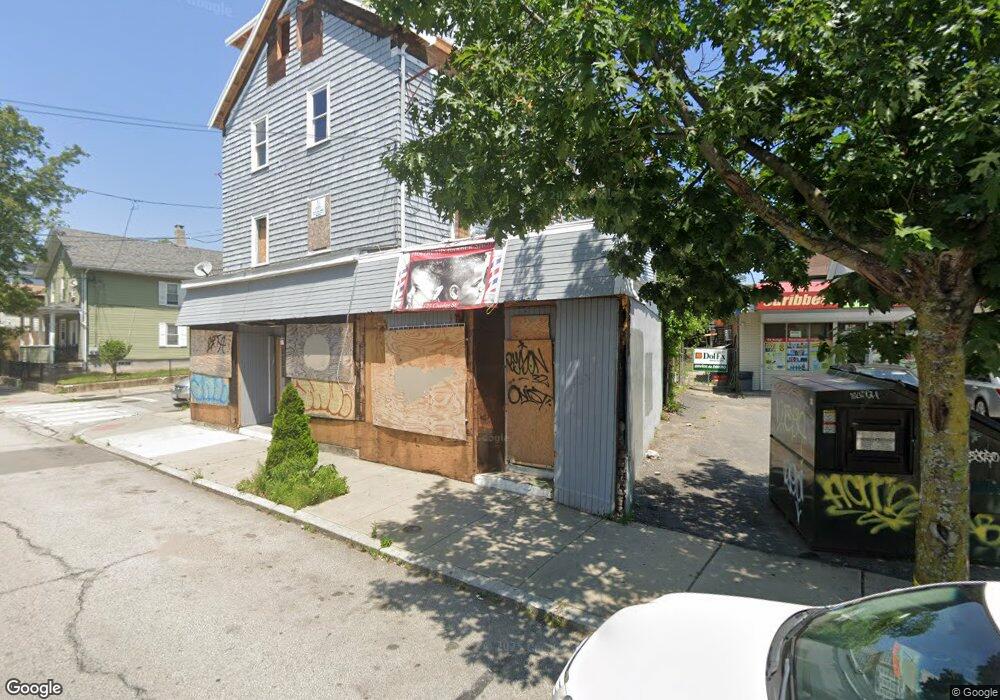
623 Charles St Providence, RI 02904
Charles NeighborhoodEstimated Value: $393,470
5
Beds
5
Baths
4,505
Sq Ft
$87/Sq Ft
Est. Value
About This Home
This home is located at 623 Charles St, Providence, RI 02904 and is currently priced at $393,470, approximately $87 per square foot. 623 Charles St is a home located in Providence County with nearby schools including Asa Messer Elementary School, Charles N. Fortes Elementary School, and Veazie Street Elementary School.
Ownership History
Date
Name
Owned For
Owner Type
Purchase Details
Closed on
Oct 29, 2024
Sold by
Dorsey John A
Bought by
Mcpherson Prop Ii Llc
Current Estimated Value
Home Financials for this Owner
Home Financials are based on the most recent Mortgage that was taken out on this home.
Original Mortgage
$1,025,000
Outstanding Balance
$1,012,623
Interest Rate
6.09%
Mortgage Type
Commercial
Purchase Details
Closed on
Jul 2, 2024
Sold by
Providence City Of
Bought by
Alves Kenneth
Purchase Details
Closed on
Jun 1, 2023
Sold by
Kqa 3217 Llc
Bought by
Kaimuki Realty Co Llc
Purchase Details
Closed on
Dec 21, 2021
Sold by
Dorsainvil Wilson
Bought by
63 Kqa 3217 Llc
Home Financials for this Owner
Home Financials are based on the most recent Mortgage that was taken out on this home.
Original Mortgage
$468,000
Interest Rate
2.98%
Mortgage Type
Purchase Money Mortgage
Purchase Details
Closed on
Mar 8, 2021
Sold by
623 Charles Street Llc
Bought by
Dorsainvil Wilson
Home Financials for this Owner
Home Financials are based on the most recent Mortgage that was taken out on this home.
Original Mortgage
$320,000
Interest Rate
2.7%
Mortgage Type
Purchase Money Mortgage
Purchase Details
Closed on
Mar 4, 1996
Sold by
Gatta Mary Lou
Bought by
Matteo Andrew Joseph
Create a Home Valuation Report for This Property
The Home Valuation Report is an in-depth analysis detailing your home's value as well as a comparison with similar homes in the area
Home Values in the Area
Average Home Value in this Area
Purchase History
| Date | Buyer | Sale Price | Title Company |
|---|---|---|---|
| Mcpherson Prop Ii Llc | $455,000 | None Available | |
| Mcpherson Prop Ii Llc | $455,000 | None Available | |
| Mcpherson Prop Ii Llc | $455,000 | None Available | |
| Mcpherson Prop Ii Llc | $455,000 | None Available | |
| Alves Kenneth | $22,666 | None Available | |
| Alves Kenneth | $22,666 | None Available | |
| Alves Kenneth | $22,666 | None Available | |
| Alves Kenneth | $22,666 | None Available | |
| Kaimuki Realty Co Llc | -- | None Available | |
| Kaimuki Realty Co Llc | -- | None Available | |
| Kaimuki Realty Co Llc | -- | None Available | |
| 63 Kqa 3217 Llc | $410,000 | None Available | |
| 63 Kqa 3217 Llc | $410,000 | None Available | |
| 63 Kqa 3217 Llc | $410,000 | None Available | |
| Dorsainvil Wilson | $380,000 | None Available | |
| Dorsainvil Wilson | $380,000 | None Available | |
| Dorsainvil Wilson | $380,000 | None Available | |
| Matteo Andrew Joseph | $60,000 | -- | |
| Matteo Andrew Joseph | $60,000 | -- |
Source: Public Records
Mortgage History
| Date | Status | Borrower | Loan Amount |
|---|---|---|---|
| Open | Mcpherson Prop Ii Llc | $1,025,000 | |
| Closed | Mcpherson Prop Ii Llc | $1,025,000 | |
| Previous Owner | 63 Kqa 3217 Llc | $468,000 | |
| Previous Owner | Dorsainvil Wilson | $320,000 | |
| Previous Owner | Matteo Andrew Joseph | $100,000 |
Source: Public Records
Tax History Compared to Growth
Tax History
| Year | Tax Paid | Tax Assessment Tax Assessment Total Assessment is a certain percentage of the fair market value that is determined by local assessors to be the total taxable value of land and additions on the property. | Land | Improvement |
|---|---|---|---|---|
| 2025 | $7,614 | $521,500 | $127,700 | $393,800 |
| 2024 | -- | $334,800 | $85,200 | $249,600 |
| 2023 | $0 | $334,800 | $85,200 | $249,600 |
| 2022 | $0 | $334,800 | $85,200 | $249,600 |
| 2021 | $0 | $238,600 | $67,100 | $171,500 |
| 2020 | $0 | $238,600 | $67,100 | $171,500 |
| 2019 | $0 | $238,600 | $67,100 | $171,500 |
| 2018 | $0 | $220,900 | $67,100 | $153,800 |
| 2017 | $0 | $220,900 | $67,100 | $153,800 |
| 2016 | -- | $220,900 | $67,100 | $153,800 |
| 2015 | -- | $206,700 | $63,900 | $142,800 |
| 2014 | -- | $206,700 | $63,900 | $142,800 |
| 2013 | -- | $206,700 | $63,900 | $142,800 |
Source: Public Records
Map
Nearby Homes