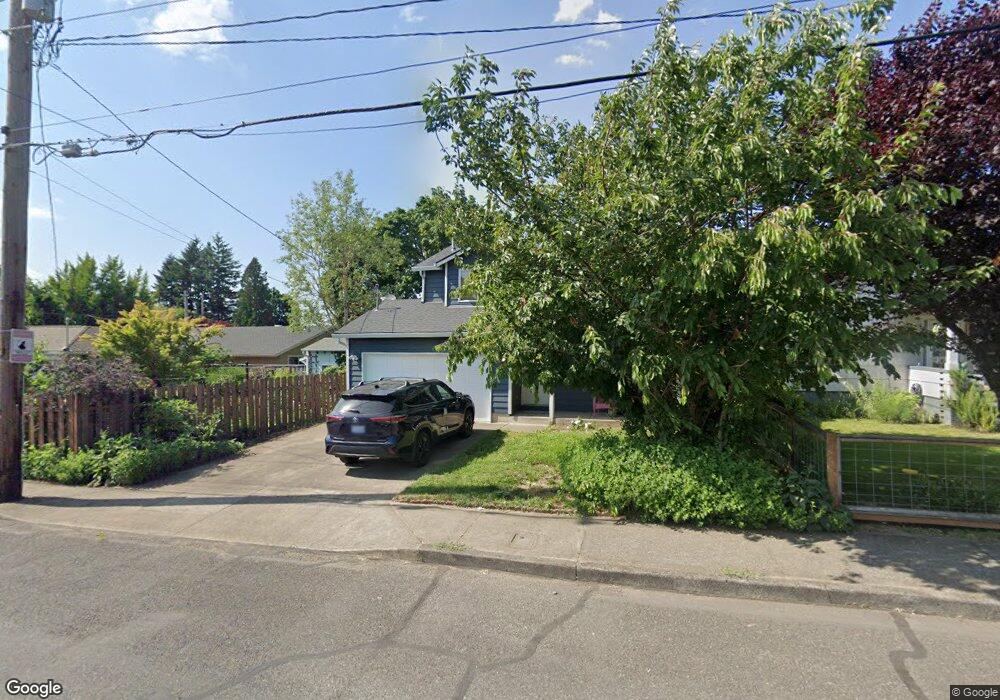
623 SE 4th St Gresham, OR 97080
Historic Southeast NeighborhoodEstimated Value: $404,000 - $439,000
3
Beds
3
Baths
1,338
Sq Ft
$313/Sq Ft
Est. Value
About This Home
This home is located at 623 SE 4th St, Gresham, OR 97080 and is currently estimated at $419,217, approximately $313 per square foot. 623 SE 4th St is a home located in Multnomah County with nearby schools including East Gresham Elementary School, Dexter McCarty Middle School, and Gresham High School.
Ownership History
Date
Name
Owned For
Owner Type
Purchase Details
Closed on
Mar 20, 2015
Sold by
Stenkamp Justin K
Bought by
Motley Kari M
Current Estimated Value
Home Financials for this Owner
Home Financials are based on the most recent Mortgage that was taken out on this home.
Original Mortgage
$221,906
Outstanding Balance
$168,572
Interest Rate
3.54%
Mortgage Type
FHA
Estimated Equity
$250,645
Purchase Details
Closed on
Sep 10, 2003
Sold by
Preligera Emerson T
Bought by
Stenkamp Justin K and Stenkamp Whitney B
Home Financials for this Owner
Home Financials are based on the most recent Mortgage that was taken out on this home.
Original Mortgage
$164,220
Interest Rate
6.3%
Mortgage Type
VA
Purchase Details
Closed on
Feb 16, 2001
Sold by
Preligera Misako T
Bought by
Preligera Emerson T
Purchase Details
Closed on
Jun 30, 1998
Sold by
Schumacher Harry A
Bought by
Preligera Emerson T and Preligera Misako T
Home Financials for this Owner
Home Financials are based on the most recent Mortgage that was taken out on this home.
Original Mortgage
$124,000
Interest Rate
7.06%
Mortgage Type
Purchase Money Mortgage
Create a Home Valuation Report for This Property
The Home Valuation Report is an in-depth analysis detailing your home's value as well as a comparison with similar homes in the area
Home Values in the Area
Average Home Value in this Area
Purchase History
| Date | Buyer | Sale Price | Title Company |
|---|---|---|---|
| Motley Kari M | $226,000 | Lawyers | |
| Stenkamp Justin K | $161,000 | Transnation | |
| Preligera Emerson T | -- | -- | |
| Preligera Emerson T | $134,000 | Ticor Title Insurance |
Source: Public Records
Mortgage History
| Date | Status | Borrower | Loan Amount |
|---|---|---|---|
| Open | Motley Kari M | $221,906 | |
| Previous Owner | Stenkamp Justin K | $164,220 | |
| Previous Owner | Preligera Emerson T | $124,000 |
Source: Public Records
Tax History
| Year | Tax Paid | Tax Assessment Tax Assessment Total Assessment is a certain percentage of the fair market value that is determined by local assessors to be the total taxable value of land and additions on the property. | Land | Improvement |
|---|---|---|---|---|
| 2025 | $4,726 | $232,240 | -- | -- |
| 2024 | $4,524 | $225,480 | -- | -- |
| 2023 | $4,122 | $218,920 | $0 | $0 |
| 2022 | $4,007 | $212,550 | $0 | $0 |
| 2021 | $3,906 | $206,360 | $0 | $0 |
| 2020 | $3,675 | $200,350 | $0 | $0 |
| 2019 | $3,579 | $194,520 | $0 | $0 |
| 2018 | $3,412 | $188,860 | $0 | $0 |
| 2017 | $3,274 | $183,360 | $0 | $0 |
| 2016 | $2,886 | $178,020 | $0 | $0 |
Source: Public Records
Map
Nearby Homes
- 417 SE Roberts Ave
- 415 SE Roberts Ave
- 234 NE Cleveland Ave
- 4740 SE 2nd St
- 4764 SE 2nd St
- 4667 SE 2nd St
- 491 NE Elliott Ave
- 318 NE Roberts Ave Unit 308
- 318 NE Roberts Ave Unit 203
- 1715 SE 5th St Unit 1725
- 0 NE 6th St
- 450 SE Hogan Rd
- 0 NE 5th St
- 511 SE 15th St
- 55 SW Lovhar Dr
- 660 NE 9th St
- 894 NE Linden Ave
- 0 SW Miller Ct Unit 470855683
- 638 SW 7th St
- 1949 SE Palmquist Rd Unit 51
- 342 SE Elliott Ave
- 609 SE 4th St
- 333 SE Linden Ct
- 332 SE Elliott Ave
- 329 SE Linden Ct
- 322 SE Elliott Ave
- 634 SE 4th St
- 350 SE Linden Ct
- 624 SE 4th St
- 317 SE Linden Ct
- 610 SE 4th St
- 310 SE Elliott Ave
- 330 SE Linden Ct
- 731 SE 4th St
- 730 SE 4th St
- 326 SE Linden Ct
- 345 SE Elliott Ave
- 535 SE 4th St
- 300 SE Elliott Ave
Your Personal Tour Guide
Ask me questions while you tour the home.