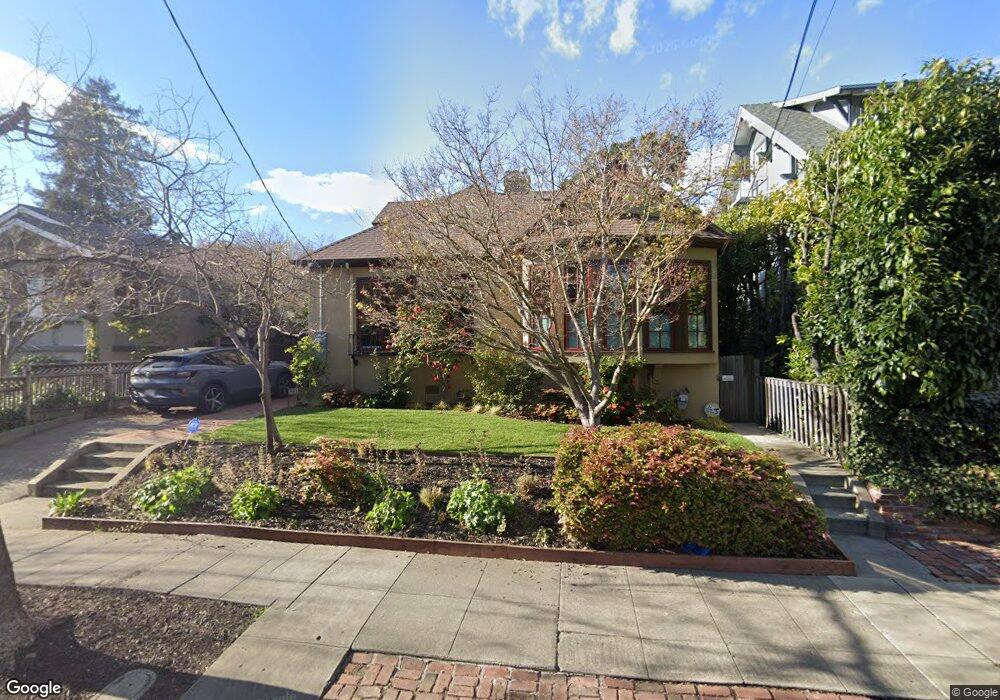
6231 Chabot Rd Oakland, CA 94618
Rockridge NeighborhoodEstimated Value: $1,891,000 - $2,240,000
3
Beds
1
Bath
2,629
Sq Ft
$795/Sq Ft
Est. Value
About This Home
This home is located at 6231 Chabot Rd, Oakland, CA 94618 and is currently estimated at $2,090,891, approximately $795 per square foot. 6231 Chabot Rd is a home located in Alameda County with nearby schools including Chabot Elementary School, Claremont Middle School, and Oakland Technical High School.
Ownership History
Date
Name
Owned For
Owner Type
Purchase Details
Closed on
Dec 22, 2010
Sold by
Decosse Stephen J and Degami Satomi
Bought by
Decosse Stephen J and Degami Satomi
Current Estimated Value
Home Financials for this Owner
Home Financials are based on the most recent Mortgage that was taken out on this home.
Original Mortgage
$285,000
Outstanding Balance
$6,353
Interest Rate
4.17%
Mortgage Type
New Conventional
Estimated Equity
$2,084,538
Purchase Details
Closed on
Mar 23, 1998
Sold by
Trust Simic Andrei & Jacquelene 1996 Revo and Simic Andrei
Bought by
Decosse Stephen J and Degami Satomi
Home Financials for this Owner
Home Financials are based on the most recent Mortgage that was taken out on this home.
Original Mortgage
$340,000
Interest Rate
7.37%
Purchase Details
Closed on
May 8, 1996
Sold by
Simic Andrei and Simic Jacquelene M
Bought by
Simic Andrei and Simic Jacquelene Mae
Create a Home Valuation Report for This Property
The Home Valuation Report is an in-depth analysis detailing your home's value as well as a comparison with similar homes in the area
Home Values in the Area
Average Home Value in this Area
Purchase History
| Date | Buyer | Sale Price | Title Company |
|---|---|---|---|
| Decosse Stephen J | -- | Fidelity National Title Co | |
| Decosse Stephen J | $425,000 | North American Title Co | |
| Simic Andrei | -- | -- |
Source: Public Records
Mortgage History
| Date | Status | Borrower | Loan Amount |
|---|---|---|---|
| Open | Decosse Stephen J | $285,000 | |
| Previous Owner | Decosse Stephen J | $340,000 |
Source: Public Records
Tax History
| Year | Tax Paid | Tax Assessment Tax Assessment Total Assessment is a certain percentage of the fair market value that is determined by local assessors to be the total taxable value of land and additions on the property. | Land | Improvement |
|---|---|---|---|---|
| 2025 | $12,254 | $832,298 | $203,575 | $628,723 |
| 2024 | $12,254 | $815,981 | $199,584 | $616,397 |
| 2023 | $11,176 | $677,238 | $195,671 | $481,567 |
| 2022 | $10,553 | $639,450 | $191,835 | $447,615 |
| 2021 | $10,107 | $626,912 | $188,073 | $438,839 |
| 2020 | $10,020 | $620,487 | $186,146 | $434,341 |
| 2019 | $9,656 | $608,323 | $182,497 | $425,826 |
| 2018 | $9,455 | $596,397 | $178,919 | $417,478 |
| 2017 | $9,099 | $584,705 | $175,411 | $409,294 |
| 2016 | $8,810 | $573,243 | $171,973 | $401,270 |
| 2015 | $9,018 | $564,633 | $169,390 | $395,243 |
| 2014 | $8,838 | $553,574 | $166,072 | $387,502 |
Source: Public Records
Map
Nearby Homes
- 6100 Chabot Rd
- 5936 Broadway
- 5910 Chabot Rd
- 6189 Margarido Dr
- 5570 Taft Ave
- 360 Alcatraz Ave
- 2800 Prince St
- 5883 Margarido Dr
- 5466 Shafter Ave
- 6446 Colby St
- 2962 Piedmont Ave
- 204 El Camino Real
- 2477 Prince St
- 5710 Margarido Dr
- 362 Hudson St
- 5499 Claremont Ave
- 5668 Buena Vista Ave
- 491 Mcauley St
- 5405 Carlton St Unit 303
- 5340 Broadway Terrace Unit 203
- 6229 Chabot Rd
- 6255 Chabot Rd
- 6221 Chabot Rd
- 6263 Chabot Rd
- 6145 Harwood Ave
- 6151 Harwood Ave
- 6133 Harwood Ave
- 6269 Chabot Rd
- 6226 Chabot Rd
- 6161 Harwood Ave
- 6215 Chabot Rd
- 6127 Harwood Ave
- 6273 Chabot Rd
- 6250 Chabot Rd
- 5839 Presley Way
- 6167 Harwood Ave
- 6121 Harwood Ave
- 5834 Presley Way
- 6279 Chabot Rd
- 5833 Presley Way
Your Personal Tour Guide
Ask me questions while you tour the home.