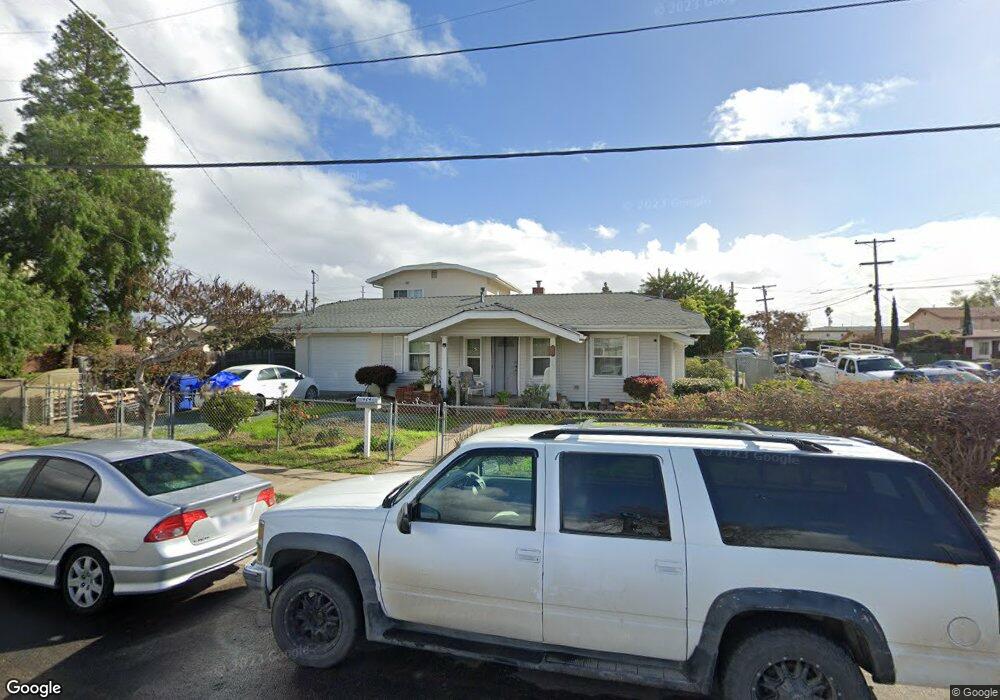
624 Chula Vista St Chula Vista, CA 91910
North Chula Vista NeighborhoodEstimated Value: $793,000 - $879,276
3
Beds
1
Bath
1,099
Sq Ft
$772/Sq Ft
Est. Value
About This Home
This home is located at 624 Chula Vista St, Chula Vista, CA 91910 and is currently estimated at $848,319, approximately $771 per square foot. 624 Chula Vista St is a home located in San Diego County with nearby schools including Chula Vista Middle School, Chula Vista High School, and Feaster (Mae L.) Charter School.
Ownership History
Date
Name
Owned For
Owner Type
Purchase Details
Closed on
Jun 25, 2020
Sold by
Padilla Ana Hilda
Bought by
Padilla Ana Hilda and Padilla Cristina
Current Estimated Value
Home Financials for this Owner
Home Financials are based on the most recent Mortgage that was taken out on this home.
Original Mortgage
$273,000
Outstanding Balance
$242,528
Interest Rate
3.2%
Mortgage Type
New Conventional
Estimated Equity
$605,792
Purchase Details
Closed on
Jun 14, 2010
Sold by
Leacy Jacqueline M
Bought by
Padilla Ana Hilda
Home Financials for this Owner
Home Financials are based on the most recent Mortgage that was taken out on this home.
Original Mortgage
$226,943
Interest Rate
4.79%
Mortgage Type
FHA
Purchase Details
Closed on
May 16, 2002
Sold by
Leacy Jacqueline M
Bought by
Leacy Jacqueline M
Create a Home Valuation Report for This Property
The Home Valuation Report is an in-depth analysis detailing your home's value as well as a comparison with similar homes in the area
Home Values in the Area
Average Home Value in this Area
Purchase History
| Date | Buyer | Sale Price | Title Company |
|---|---|---|---|
| Padilla Ana Hilda | -- | Bnt Title Company California | |
| Padilla Ana Hilda | $230,000 | Lawyers Title | |
| Leacy Jacqueline M | -- | Landsafe Title |
Source: Public Records
Mortgage History
| Date | Status | Borrower | Loan Amount |
|---|---|---|---|
| Open | Padilla Ana Hilda | $273,000 | |
| Closed | Padilla Ana Hilda | $226,943 |
Source: Public Records
Tax History Compared to Growth
Tax History
| Year | Tax Paid | Tax Assessment Tax Assessment Total Assessment is a certain percentage of the fair market value that is determined by local assessors to be the total taxable value of land and additions on the property. | Land | Improvement |
|---|---|---|---|---|
| 2025 | $4,608 | $406,308 | $256,230 | $150,078 |
| 2024 | $4,608 | $398,342 | $251,206 | $147,136 |
| 2023 | $4,544 | $390,532 | $246,281 | $144,251 |
| 2022 | $4,412 | $382,875 | $241,452 | $141,423 |
| 2021 | $4,309 | $375,368 | $236,718 | $138,650 |
| 2020 | $4,205 | $371,520 | $234,291 | $137,229 |
| 2019 | $4,095 | $364,237 | $229,698 | $134,539 |
| 2018 | $4,031 | $357,096 | $225,195 | $131,901 |
| 2017 | $3,945 | $350,095 | $220,780 | $129,315 |
| 2016 | $3,234 | $288,917 | $216,451 | $72,466 |
| 2015 | $2,739 | $245,179 | $213,200 | $31,979 |
| 2014 | $2,692 | $240,377 | $209,024 | $31,353 |
Source: Public Records
Map
Nearby Homes
- 680-84 Chula Vista St
- 54-58 Smith Ave
- 120 Madison Ave
- 695 Sea Vale St Unit 205
- 695 Sea Vale St Unit 509
- 719 Seaside St
- 758 Seaside St
- 100 Woodlawn Ave Unit 96
- 134-38 5th Ave
- 141 Brightwood Ave
- 468 Davidson St
- 462 Davidson St
- 456 Davidson St
- 316 E 31st St
- 50 Via Nomentana
- 677 G St Unit 161
- 677 G St Unit 103.5
- 677 G St Unit 51
- 731 G St Unit SPC E10
- 536 Park Way Unit 41,42
- 81 Madison Ave
- 618 Chula Vista St
- 629 Chula Vista St
- 621 Chula Vista St Unit 23
- 78 Madison Ave Unit A-C
- 78 Madison Ave Unit A
- 50 Madison Ave
- 617 First Ave
- 617 Chula Vista St
- 78A Madison Ave Unit C
- 85-91 Madison Ave
- 85 Madison Ave Unit 91
- 639 Chula Vista St Unit 45
- 82 Madison Ave
- 615 Chula Vista St
- 47 Madison Ave
- 86 Madison Ave
- 92 Madison Ave
- 45 Madison Ave
- 46 Madison Ave Unit 3