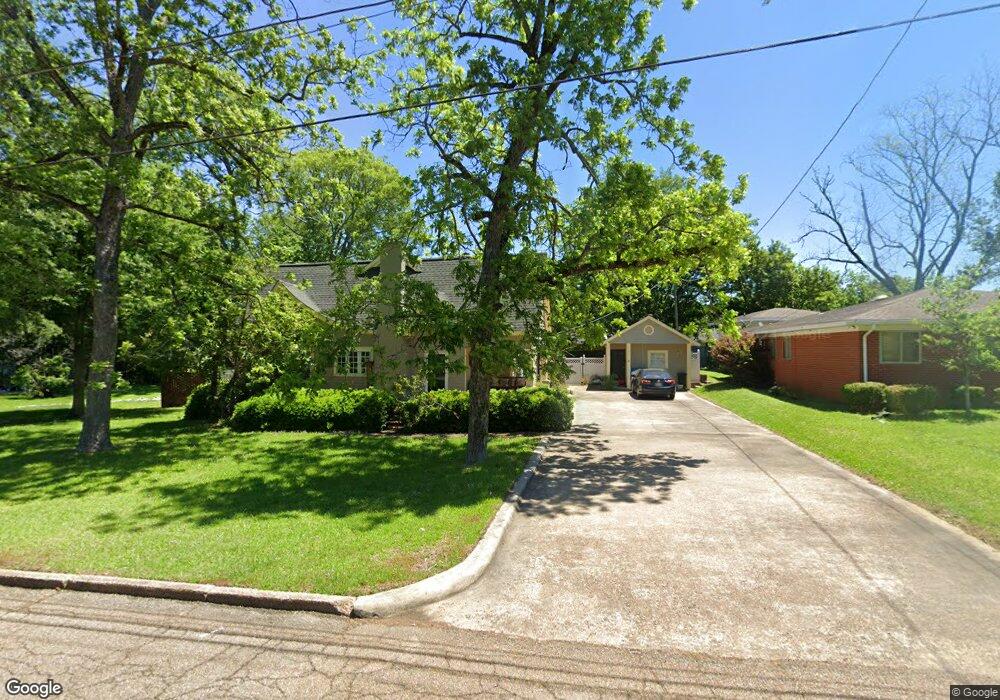
624 Commerce St West Point, MS 39773
Estimated Value: $194,000 - $243,000
4
Beds
--
Bath
2,587
Sq Ft
$84/Sq Ft
Est. Value
About This Home
This home is located at 624 Commerce St, West Point, MS 39773 and is currently estimated at $218,598, approximately $84 per square foot. 624 Commerce St is a home located in Clay County with nearby schools including East Side Elementary School, West Clay Elementary School, and Church Hill Elementary School.
Ownership History
Date
Name
Owned For
Owner Type
Purchase Details
Closed on
Oct 17, 2025
Sold by
Byrd Harrell Holly and Byrd James Griffiths
Bought by
Venarske Nathaniel and Venarske Kristin
Current Estimated Value
Home Financials for this Owner
Home Financials are based on the most recent Mortgage that was taken out on this home.
Original Mortgage
$160,000
Outstanding Balance
$157,727
Interest Rate
6.35%
Mortgage Type
Credit Line Revolving
Estimated Equity
$60,871
Purchase Details
Closed on
Jun 23, 2023
Sold by
Rainey Daniel G and Rainey Idabelle
Bought by
Byrd Harrell Holly
Home Financials for this Owner
Home Financials are based on the most recent Mortgage that was taken out on this home.
Original Mortgage
$136,709
Interest Rate
6.35%
Mortgage Type
New Conventional
Create a Home Valuation Report for This Property
The Home Valuation Report is an in-depth analysis detailing your home's value as well as a comparison with similar homes in the area
Purchase History
| Date | Buyer | Sale Price | Title Company |
|---|---|---|---|
| Venarske Nathaniel | -- | None Listed On Document | |
| Byrd Harrell Holly | -- | None Listed On Document |
Source: Public Records
Mortgage History
| Date | Status | Borrower | Loan Amount |
|---|---|---|---|
| Open | Venarske Nathaniel | $160,000 | |
| Previous Owner | Byrd Harrell Holly | $136,709 |
Source: Public Records
Tax History
| Year | Tax Paid | Tax Assessment Tax Assessment Total Assessment is a certain percentage of the fair market value that is determined by local assessors to be the total taxable value of land and additions on the property. | Land | Improvement |
|---|---|---|---|---|
| 2025 | $1,244 | $22,936 | $2,203 | $20,733 |
| 2024 | $1,244 | $22,936 | $2,203 | $20,733 |
| 2023 | $929 | $13,706 | $1,469 | $12,237 |
| 2022 | $341 | $13,706 | $1,469 | $12,237 |
| 2021 | $339 | $13,706 | $1,469 | $12,237 |
| 2020 | $341 | $13,706 | $1,469 | $12,237 |
| 2019 | $317 | $13,674 | $1,469 | $12,205 |
| 2018 | $305 | $13,674 | $1,469 | $12,205 |
| 2017 | $304 | $13,674 | $1,469 | $12,205 |
| 2016 | $298 | $13,674 | $1,469 | $12,205 |
| 2015 | $241 | $12,333 | $1,469 | $10,864 |
| 2014 | $380 | $12,333 | $1,469 | $10,864 |
| 2013 | $380 | $12,333 | $1,469 | $10,864 |
Source: Public Records
Map
Nearby Homes
- 184 Tournament St
- 238 Calhoun St
- 33 Court
- 228 S Division St
- 229 S Division St
- 74 Tom Bayne St
- 480 E Westbrook St
- 551 E Westbrook St
- 26788 E Main St
- 159 Washington St
- 26852 E Main St
- 123 Cottrell St
- 1046 E Brame Ave
- 26596 E Main St
- 341 Mccord St
- 228 Mccord St
- 27045 E Main St
- 507 S Eshman Ave
- 15 David St
- 405 S Eshman Ave
- 142 Commerce St
- 630 Commerce St
- 623 Cromwell St
- 616 Commerce St
- 485 Cromwell St
- 416 Travis St
- 619 Commerce St
- 629 Commerce St
- 471 Cromwell St
- 638 Commerce St
- 613 Cromwell St
- 422 Travis St
- 701 Cromwell St
- 601 Commerce St
- 641 Commerce St
- 628 Cromwell St
- 620 Cromwell St
- 200 Commerce St
- 614 Cromwell St
- 441 Cromwell St
Your Personal Tour Guide
Ask me questions while you tour the home.