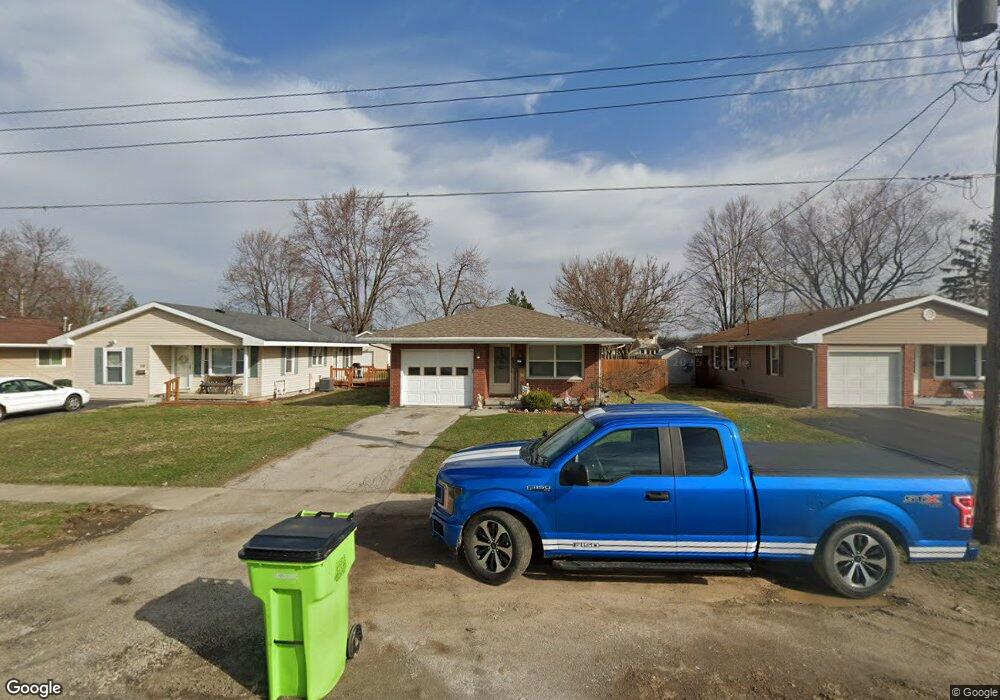
624 Swing Ave Findlay, OH 45840
Estimated Value: $145,000 - $161,000
3
Beds
1
Bath
952
Sq Ft
$161/Sq Ft
Est. Value
About This Home
This home is located at 624 Swing Ave, Findlay, OH 45840 and is currently estimated at $152,985, approximately $160 per square foot. 624 Swing Ave is a home located in Hancock County with nearby schools including Northview Elementary School, Bigelow Hill Elementary School, and Glenwood Middle School.
Ownership History
Date
Name
Owned For
Owner Type
Purchase Details
Closed on
May 29, 2018
Sold by
Eyly James D and Eyly Traci A
Bought by
Franklin Heidi M
Current Estimated Value
Home Financials for this Owner
Home Financials are based on the most recent Mortgage that was taken out on this home.
Original Mortgage
$102,116
Outstanding Balance
$90,414
Interest Rate
5.62%
Mortgage Type
FHA
Estimated Equity
$62,571
Purchase Details
Closed on
Jan 27, 2015
Sold by
The Huntington National Bank
Bought by
Wolke Kevin J
Purchase Details
Closed on
Mar 19, 2014
Sold by
Fannie Mae
Bought by
The Hunstington National Bank
Purchase Details
Closed on
Jan 23, 2014
Sold by
Gilliam Nelda R
Bought by
Fannie Mae
Purchase Details
Closed on
Dec 4, 2009
Sold by
Estate Of Darrell D Gilliam
Bought by
Gilliam Nelda R
Purchase Details
Closed on
Feb 26, 1992
Bought by
Gilliam Darrell D and Gilliam Nelda
Purchase Details
Closed on
Aug 5, 1985
Bought by
Sausser Maver J
Create a Home Valuation Report for This Property
The Home Valuation Report is an in-depth analysis detailing your home's value as well as a comparison with similar homes in the area
Home Values in the Area
Average Home Value in this Area
Purchase History
| Date | Buyer | Sale Price | Title Company |
|---|---|---|---|
| Franklin Heidi M | $104,000 | Mid Am Title | |
| Wolke Kevin J | $38,000 | Attorney | |
| The Hunstington National Bank | -- | First American Title Ins Co | |
| Fannie Mae | $32,000 | Attorney | |
| Gilliam Nelda R | -- | Whitman Title | |
| Gilliam Darrell D | $40,000 | -- | |
| Sausser Maver J | $29,400 | -- |
Source: Public Records
Mortgage History
| Date | Status | Borrower | Loan Amount |
|---|---|---|---|
| Open | Franklin Heidi M | $102,116 |
Source: Public Records
Tax History
| Year | Tax Paid | Tax Assessment Tax Assessment Total Assessment is a certain percentage of the fair market value that is determined by local assessors to be the total taxable value of land and additions on the property. | Land | Improvement |
|---|---|---|---|---|
| 2024 | $1,324 | $37,260 | $5,200 | $32,060 |
| 2023 | $1,326 | $37,260 | $5,200 | $32,060 |
| 2022 | $1,321 | $37,260 | $5,200 | $32,060 |
| 2021 | $1,354 | $33,260 | $5,200 | $28,060 |
| 2020 | $1,354 | $33,260 | $5,200 | $28,060 |
| 2019 | $1,326 | $33,260 | $5,200 | $28,060 |
| 2018 | $1,063 | $24,450 | $4,410 | $20,040 |
| 2017 | $1,092 | $24,450 | $4,410 | $20,040 |
| 2016 | $1,087 | $24,450 | $4,410 | $20,040 |
| 2015 | $1,118 | $24,850 | $4,410 | $20,440 |
| 2014 | $1,118 | $24,850 | $4,410 | $20,440 |
| 2012 | $1,126 | $24,850 | $4,410 | $20,440 |
Source: Public Records
Map
Nearby Homes
- 705 Swing Ave
- 605 Davis St
- 719 Davis St
- 421 Clifton Ave
- 405 Clifton Ave
- 243 Monroe Ave
- 528 Rector Ave
- 140 Monroe Ave
- 146 Clifton Ave
- 341 Defiance Ave
- 724 Edith Ave
- 217 Prentiss Ave
- 701 W Melrose Ave
- 239 Edith Ave
- 315 W Melrose Ave
- 925 W Melrose Ave
- 206 Midland Ave
- 2318 Anna St
- 120 W Melrose Ave
- 301 Allen Ave
Your Personal Tour Guide
Ask me questions while you tour the home.