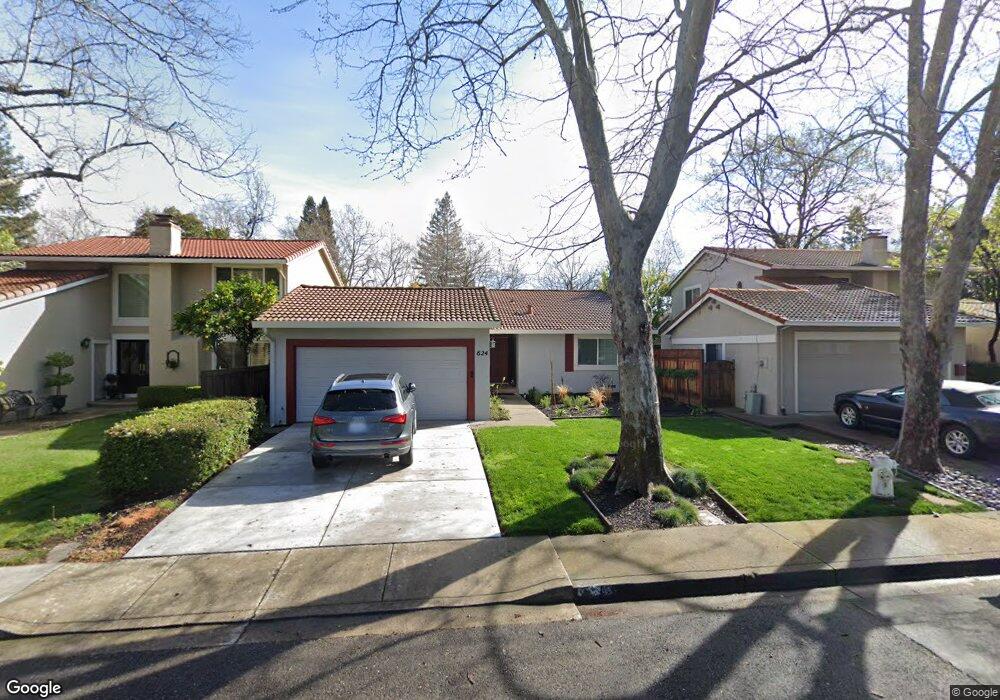
624 Tunbridge Rd Danville, CA 94526
Estimated Value: $1,248,000 - $1,446,000
3
Beds
2
Baths
1,418
Sq Ft
$958/Sq Ft
Est. Value
About This Home
This home is located at 624 Tunbridge Rd, Danville, CA 94526 and is currently estimated at $1,357,923, approximately $957 per square foot. 624 Tunbridge Rd is a home located in Contra Costa County with nearby schools including Vista Grande Elementary School, Los Cerros Middle School, and Monte Vista High School.
Ownership History
Date
Name
Owned For
Owner Type
Purchase Details
Closed on
Aug 16, 2019
Sold by
Fagrey Dylan M
Bought by
Fagrey Dylan M and Fagrey Samuel S
Current Estimated Value
Purchase Details
Closed on
Dec 27, 2017
Sold by
Schwartz Gregory R
Bought by
Fagrey Peter Joseph
Home Financials for this Owner
Home Financials are based on the most recent Mortgage that was taken out on this home.
Original Mortgage
$340,000
Outstanding Balance
$286,324
Interest Rate
3.95%
Mortgage Type
New Conventional
Estimated Equity
$1,071,599
Purchase Details
Closed on
Dec 12, 2017
Sold by
Fagrey Cynthia
Bought by
Fagrey Peter Joseph
Home Financials for this Owner
Home Financials are based on the most recent Mortgage that was taken out on this home.
Original Mortgage
$340,000
Outstanding Balance
$286,324
Interest Rate
3.95%
Mortgage Type
New Conventional
Estimated Equity
$1,071,599
Purchase Details
Closed on
Dec 22, 2005
Sold by
Schwartz Virginia R
Bought by
Schwartz Gregory R
Create a Home Valuation Report for This Property
The Home Valuation Report is an in-depth analysis detailing your home's value as well as a comparison with similar homes in the area
Home Values in the Area
Average Home Value in this Area
Purchase History
| Date | Buyer | Sale Price | Title Company |
|---|---|---|---|
| Fagrey Dylan M | -- | None Available | |
| Fagrey Peter Joseph | $847,000 | Fidelity National Title Conc | |
| Fagrey Peter Joseph | -- | Fidelity National Title Conc | |
| Schwartz Gregory R | -- | None Available |
Source: Public Records
Mortgage History
| Date | Status | Borrower | Loan Amount |
|---|---|---|---|
| Open | Fagrey Peter Joseph | $340,000 |
Source: Public Records
Tax History Compared to Growth
Tax History
| Year | Tax Paid | Tax Assessment Tax Assessment Total Assessment is a certain percentage of the fair market value that is determined by local assessors to be the total taxable value of land and additions on the property. | Land | Improvement |
|---|---|---|---|---|
| 2025 | $11,319 | $963,736 | $739,587 | $224,149 |
| 2024 | $11,143 | $944,840 | $725,086 | $219,754 |
| 2023 | $11,143 | $926,315 | $710,869 | $215,446 |
| 2022 | $11,062 | $908,153 | $696,931 | $211,222 |
| 2021 | $10,826 | $890,347 | $683,266 | $207,081 |
| 2019 | $10,521 | $863,940 | $663,000 | $200,940 |
| 2018 | $10,209 | $847,000 | $650,000 | $197,000 |
| 2017 | $1,820 | $85,755 | $23,717 | $62,038 |
| 2016 | $1,773 | $84,074 | $23,252 | $60,822 |
| 2015 | $1,731 | $82,812 | $22,903 | $59,909 |
| 2014 | $1,689 | $81,191 | $22,455 | $58,736 |
Source: Public Records
Map
Nearby Homes
- 33 Leeds Ct E
- 144 Tweed Dr
- 491 Scotts Mill Rd
- 651 Derbyshire Place
- 61 Ambleside Ct
- 336 Merrilee Place
- 324 Merrilee Place
- 131 Clover Hill Ct
- 275 Gil Blas Rd
- 10 Glasgow Cir
- 40 Edinburgh Place
- 1213 Dutch Mill Dr
- 5 Stuart Place
- 90 Princeton Ct
- 382 Bolero Dr
- 851 Luz Ct
- 843 Luz Ct
- 211 Arthur Ct
- 800 El Capitan Dr
- 500 Sycamore Cir
- 632 Tunbridge Rd
- 616 Tunbridge Rd
- 640 Tunbridge Rd
- 608 Tunbridge Rd
- 605 Bridgewater Cir
- 607 Bridgewater Cir
- 611 Bridgewater Cir
- 600 Tunbridge Rd
- 745 Old Creek Rd
- 648 Tunbridge Rd
- 656 Tunbridge Rd
- 615 Tunbridge Rd
- 617 Tunbridge Rd
- 623 Tunbridge Rd
- 641 Tunbridge Rd
- 729 Old Creek Rd
- 664 Tunbridge Rd
- 617 Bridgewater Cir
- 649 Tunbridge Rd
- 672 Tunbridge Rd