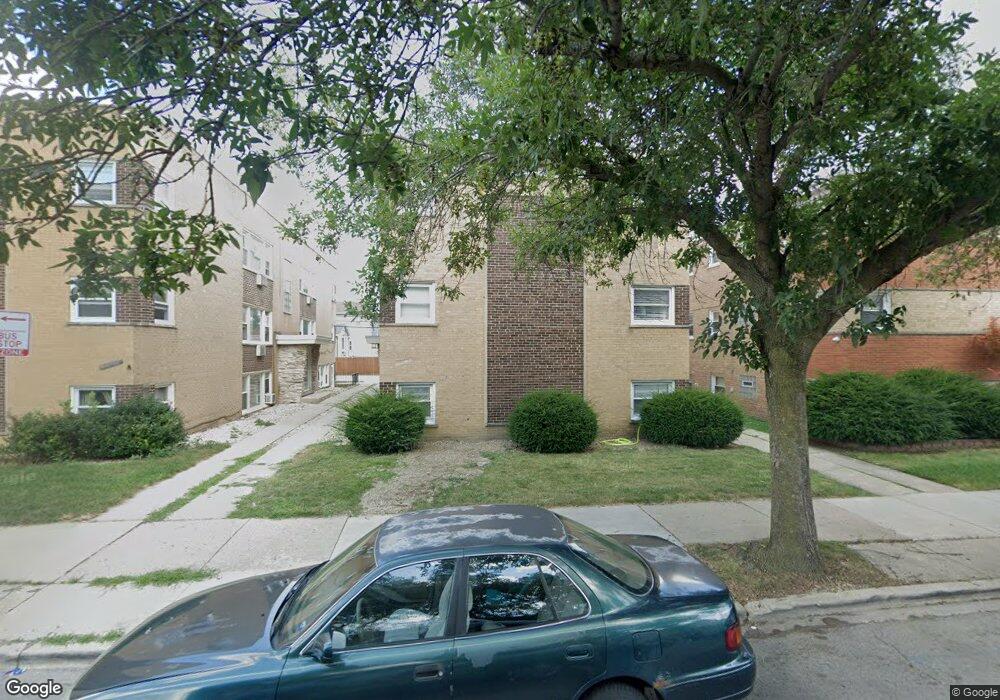
6248 W Montrose Ave Unit GFRON Chicago, IL 60634
Jefferson Park NeighborhoodEstimated Value: $193,000 - $222,335
--
Bed
--
Bath
6,300
Sq Ft
$34/Sq Ft
Est. Value
About This Home
This home is located at 6248 W Montrose Ave Unit GFRON, Chicago, IL 60634 and is currently estimated at $211,084, approximately $33 per square foot. 6248 W Montrose Ave Unit GFRON is a home located in Cook County with nearby schools including Smyser Elementary School, Taft High School, and St. Robert Bellarmine Catholic School.
Ownership History
Date
Name
Owned For
Owner Type
Purchase Details
Closed on
Mar 6, 2025
Sold by
R & R Compositions Llc
Bought by
Castillo Adriana
Current Estimated Value
Home Financials for this Owner
Home Financials are based on the most recent Mortgage that was taken out on this home.
Original Mortgage
$7,500
Outstanding Balance
$6,102
Interest Rate
6.96%
Mortgage Type
New Conventional
Estimated Equity
$204,982
Purchase Details
Closed on
Jun 25, 2024
Sold by
Gerald Norris Trust and Norris Gerald
Bought by
R & R Compositions Llc
Purchase Details
Closed on
Aug 20, 2004
Sold by
Norris Gerald
Bought by
Norris Gerald and Gerald Norris Trust
Purchase Details
Closed on
Apr 25, 2001
Sold by
Grabska Teresa M
Bought by
Norris Gerald
Home Financials for this Owner
Home Financials are based on the most recent Mortgage that was taken out on this home.
Original Mortgage
$70,000
Interest Rate
6.99%
Create a Home Valuation Report for This Property
The Home Valuation Report is an in-depth analysis detailing your home's value as well as a comparison with similar homes in the area
Home Values in the Area
Average Home Value in this Area
Purchase History
| Date | Buyer | Sale Price | Title Company |
|---|---|---|---|
| Castillo Adriana | $208,000 | None Listed On Document | |
| R & R Compositions Llc | $145,000 | None Listed On Document | |
| Norris Gerald | -- | -- | |
| Norris Gerald | $118,000 | -- |
Source: Public Records
Mortgage History
| Date | Status | Borrower | Loan Amount |
|---|---|---|---|
| Open | Castillo Adriana | $7,500 | |
| Open | Castillo Adriana | $197,505 | |
| Previous Owner | Norris Gerald | $70,000 |
Source: Public Records
Tax History Compared to Growth
Tax History
| Year | Tax Paid | Tax Assessment Tax Assessment Total Assessment is a certain percentage of the fair market value that is determined by local assessors to be the total taxable value of land and additions on the property. | Land | Improvement |
|---|---|---|---|---|
| 2024 | $2,321 | $15,017 | $3,139 | $11,878 |
| 2023 | $2,262 | $11,000 | $2,511 | $8,489 |
| 2022 | $2,262 | $11,000 | $2,511 | $8,489 |
| 2021 | $2,212 | $10,999 | $2,510 | $8,489 |
| 2020 | $3,109 | $13,956 | $1,120 | $12,836 |
| 2019 | $3,139 | $15,626 | $1,120 | $14,506 |
| 2018 | $3,087 | $15,626 | $1,120 | $14,506 |
| 2017 | $2,311 | $10,737 | $986 | $9,751 |
| 2016 | $2,151 | $10,737 | $986 | $9,751 |
| 2015 | $1,006 | $10,737 | $986 | $9,751 |
| 2014 | $1,898 | $12,800 | $941 | $11,859 |
| 2013 | $1,850 | $12,800 | $941 | $11,859 |
Source: Public Records
Map
Nearby Homes
- 4305 N Mobile Ave
- 4447 N Merrimac Ave
- 4442 N Melvina Ave
- 4433 N Narragansett Ave
- 4518 N Merrimac Ave
- 4526 N Mobile Ave
- 6248 W Berteau Ave
- 4546 N Merrimac Ave
- 4544 N Mulligan Ave
- 6450 W Montrose Ave
- 4567 N Merrimac Ave
- 4345 N Mcvicker Ave
- 4240 N Mcvicker Ave
- 4106 N Mobile Ave
- 6519 W Forest Preserve Ave
- 6450 W Berteau Ave Unit 201
- 6400 W Belle Plaine Ave Unit 303
- 4533 N Mcvicker Ave
- 4103 N Narragansett Ave
- 6430 W Belle Plaine Ave Unit 307
- 6248 W Montrose Ave Unit 1REAR
- 6248 W Montrose Ave Unit 2FRON
- 6248 W Montrose Ave Unit 2REAR
- 6248 W Montrose Ave Unit 1FRON
- 6248 W Montrose Ave Unit GREAR
- 6248 W Montrose Ave Unit 2F
- 6248 W Montrose Ave Unit 1F
- 6244 W Montrose Ave
- 6252 W Montrose Ave Unit 2N
- 6252 W Montrose Ave Unit 1N
- 6252 W Montrose Ave Unit 1S
- 6252 W Montrose Ave Unit GN
- 6252 W Montrose Ave Unit 2S
- 6252 W Montrose Ave Unit GS
- 6252 W Montrose Ave Unit P5
- 6252 W Montrose Ave Unit P4
- 6252 W Montrose Ave Unit P3
- 6252 W Montrose Ave Unit 2P
- 6252 W Montrose Ave Unit 1P
- 6238 W Montrose Ave