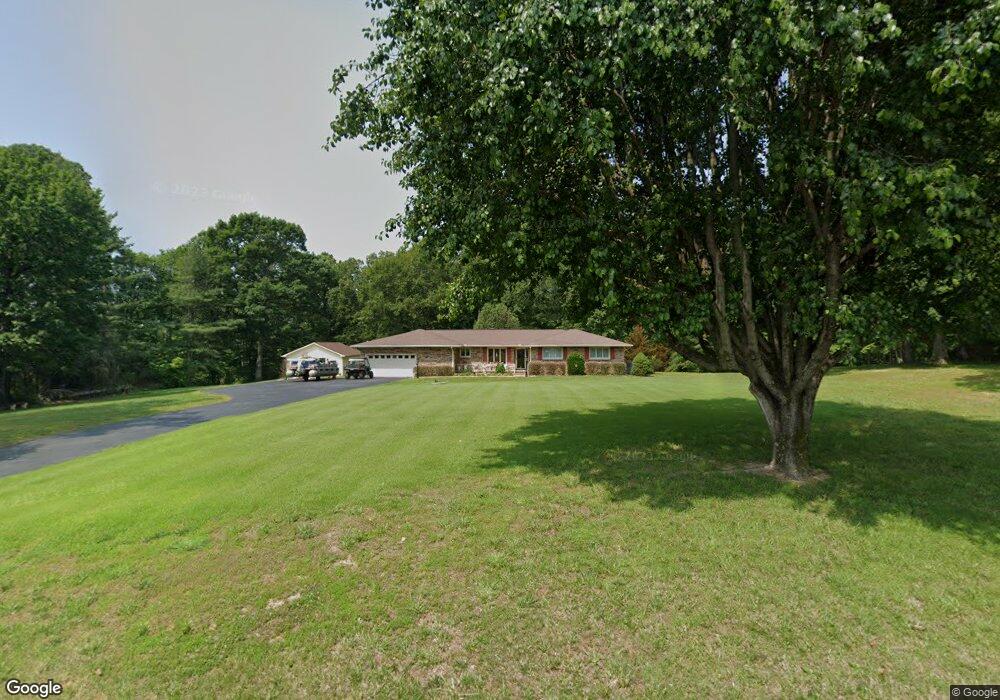
625 Hillview Rd Dickson, TN 37055
Estimated Value: $330,000 - $414,000
Studio
2
Baths
1,513
Sq Ft
$243/Sq Ft
Est. Value
About This Home
This home is located at 625 Hillview Rd, Dickson, TN 37055 and is currently estimated at $367,505, approximately $242 per square foot. 625 Hillview Rd is a home located in Dickson County with nearby schools including Centennial Elementary School, Dickson Middle School, and Dickson County High School.
Ownership History
Date
Name
Owned For
Owner Type
Purchase Details
Closed on
Sep 21, 2023
Sold by
Karr Kelly and French Amy K
Bought by
French Amy K and French Cliff
Current Estimated Value
Home Financials for this Owner
Home Financials are based on the most recent Mortgage that was taken out on this home.
Original Mortgage
$312,000
Outstanding Balance
$304,501
Interest Rate
7.18%
Mortgage Type
New Conventional
Estimated Equity
$63,004
Purchase Details
Closed on
Feb 28, 2023
Sold by
Seaton Ronald
Bought by
Shelton Billy
Purchase Details
Closed on
May 5, 2021
Sold by
Seaton Ronald and Seaton Beverly J
Bought by
French Amy and Karr Kelly
Purchase Details
Closed on
Apr 24, 2017
Sold by
Shelton Billy
Bought by
Shelton Billy & Rowena
Purchase Details
Closed on
Mar 17, 1977
Bought by
Shelton Billy and Shelton Rowena
Create a Home Valuation Report for This Property
The Home Valuation Report is an in-depth analysis detailing your home's value as well as a comparison with similar homes in the area
Home Values in the Area
Average Home Value in this Area
Purchase History
| Date | Buyer | Sale Price | Title Company |
|---|---|---|---|
| French Amy K | -- | None Listed On Document | |
| Shelton Billy | -- | -- | |
| French Amy | -- | None Available | |
| Seaton Beverly J | -- | None Available | |
| Shelton Billy & Rowena | -- | -- | |
| Shelton Billy | -- | -- |
Source: Public Records
Mortgage History
| Date | Status | Borrower | Loan Amount |
|---|---|---|---|
| Open | French Amy K | $312,000 |
Source: Public Records
Tax History
| Year | Tax Paid | Tax Assessment Tax Assessment Total Assessment is a certain percentage of the fair market value that is determined by local assessors to be the total taxable value of land and additions on the property. | Land | Improvement |
|---|---|---|---|---|
| 2025 | $1,609 | $95,225 | $32,725 | $62,500 |
| 2024 | $1,609 | $95,225 | $32,725 | $62,500 |
| 2023 | $1,281 | $54,500 | $9,225 | $45,275 |
| 2022 | $1,281 | $54,500 | $9,225 | $45,275 |
| 2021 | $1,281 | $54,500 | $9,225 | $45,275 |
| 2020 | $1,281 | $54,500 | $9,225 | $45,275 |
| 2019 | $1,281 | $54,500 | $9,225 | $45,275 |
| 2018 | $1,035 | $38,325 | $6,925 | $31,400 |
| 2017 | $1,035 | $38,325 | $6,925 | $31,400 |
| 2016 | $1,035 | $38,325 | $6,925 | $31,400 |
| 2015 | $962 | $33,175 | $6,925 | $26,250 |
| 2014 | $962 | $33,175 | $6,925 | $26,250 |
Source: Public Records
Map
Nearby Homes
- 1418 Ridge Rd
- 1300 Ridge Rd
- 999 Stewart Rd
- 1323 Old Stage Rd
- 1425 Old Stage Rd
- 1429 Old Stage Rd
- 1155 Westfield Rd
- 251 Rouse Rd
- 0 Sylvia Rd Unit RTC3098486
- 0 Sylvia Rd Unit RTC3098156
- 0 Sylvia Rd Unit RTC3098487
- 0 Sylvia Rd Unit RTC3047451
- 0 Sylvia Rd Unit RTC3098485
- 0 Sylvia Rd Unit RTC3093560
- 3205 Sylvia Rd
- 1049 Big Bartons Creek Rd
- 1135 High Lake Dr
- 0 Rouse Rd
- 228 Druid Hills Dr
- 111 Rouse Rd
- 628 Hillview Rd
- 638 Hillview Rd N
- 0 Hillview Rd Unit 1656489
- 0 Hillview Rd Unit 1288279
- 0 Hillview Rd Unit 1757724
- 0 Hillview Rd Unit RTC1410169
- 0 Hillview Rd Unit 2062271
- 590 Hillview Rd
- 655 Hillview Rd
- 655 Hillview Rd
- 1490 Ridge Rd
- 1506 Ridge Rd
- 1503 Ridge Rd
- 1520 Ridge Rd
- 1470 Ridge Rd
- 586 Hillview Rd
- 1481 Ridge Rd
- 1466 Ridge Rd
- 580 Hillview Rd
- 1622 Ridge Rd
Your Personal Tour Guide
Ask me questions while you tour the home.