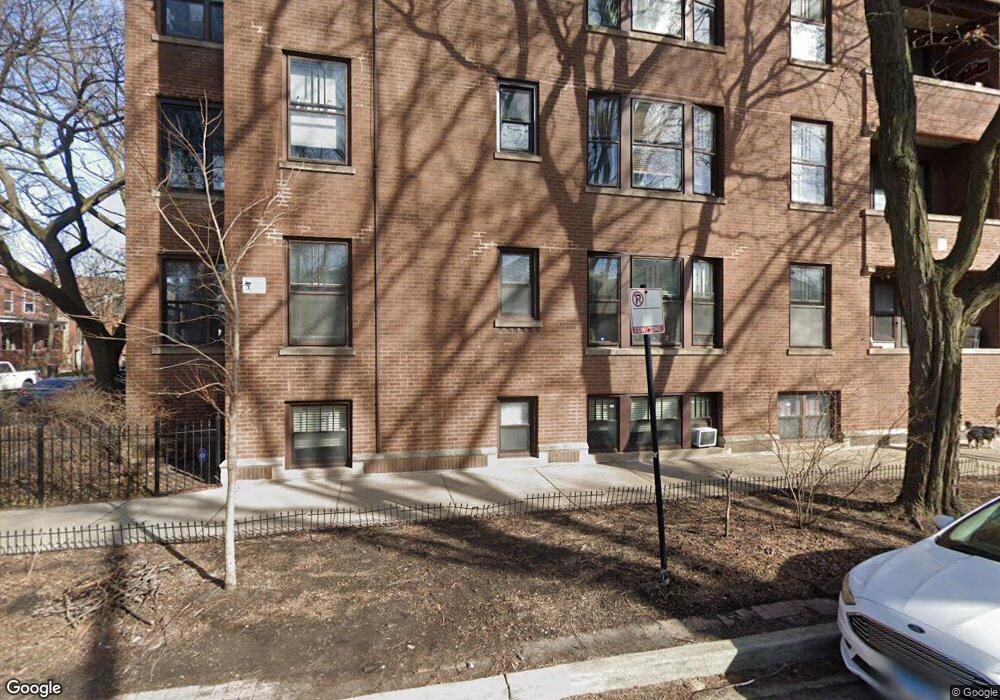
6257 N Greenview Ave Unit 6257 Chicago, IL 60660
Edgewater NeighborhoodEstimated Value: $201,000 - $258,000
1
Bed
1
Bath
22,908
Sq Ft
$10/Sq Ft
Est. Value
About This Home
This home is located at 6257 N Greenview Ave Unit 6257, Chicago, IL 60660 and is currently estimated at $227,313, approximately $9 per square foot. 6257 N Greenview Ave Unit 6257 is a home located in Cook County with nearby schools including Hayt Elementary School, Senn High School, and Northside Catholic Academy.
Ownership History
Date
Name
Owned For
Owner Type
Purchase Details
Closed on
Jun 28, 2019
Sold by
Saviers Laurence M and Saviers Lawrence M
Bought by
Sobczak Matthew D and Zhou Luhan T
Current Estimated Value
Home Financials for this Owner
Home Financials are based on the most recent Mortgage that was taken out on this home.
Original Mortgage
$152,950
Outstanding Balance
$136,115
Interest Rate
4.62%
Mortgage Type
New Conventional
Estimated Equity
$91,198
Purchase Details
Closed on
Jan 26, 1998
Sold by
Matthews Kalyn J
Bought by
Saviers Lawrence M
Home Financials for this Owner
Home Financials are based on the most recent Mortgage that was taken out on this home.
Original Mortgage
$75,050
Interest Rate
7.37%
Purchase Details
Closed on
Apr 15, 1996
Sold by
The Chicago Trust Company
Bought by
Smith Christopher R
Home Financials for this Owner
Home Financials are based on the most recent Mortgage that was taken out on this home.
Original Mortgage
$68,300
Interest Rate
7.86%
Create a Home Valuation Report for This Property
The Home Valuation Report is an in-depth analysis detailing your home's value as well as a comparison with similar homes in the area
Home Values in the Area
Average Home Value in this Area
Purchase History
| Date | Buyer | Sale Price | Title Company |
|---|---|---|---|
| Sobczak Matthew D | $161,000 | Chicago Title | |
| Saviers Lawrence M | $79,000 | Chicago Title Insurance Co | |
| Smith Christopher R | $72,000 | -- |
Source: Public Records
Mortgage History
| Date | Status | Borrower | Loan Amount |
|---|---|---|---|
| Open | Sobczak Matthew D | $152,950 | |
| Previous Owner | Saviers Lawrence M | $75,050 | |
| Previous Owner | Smith Christopher R | $68,300 |
Source: Public Records
Tax History Compared to Growth
Tax History
| Year | Tax Paid | Tax Assessment Tax Assessment Total Assessment is a certain percentage of the fair market value that is determined by local assessors to be the total taxable value of land and additions on the property. | Land | Improvement |
|---|---|---|---|---|
| 2024 | $3,376 | $18,645 | $3,795 | $14,850 |
| 2023 | $3,291 | $16,000 | $3,052 | $12,948 |
| 2022 | $3,291 | $16,000 | $3,052 | $12,948 |
| 2021 | $3,217 | $15,999 | $3,051 | $12,948 |
| 2020 | $2,991 | $13,426 | $1,754 | $11,672 |
| 2019 | $2,296 | $14,856 | $1,754 | $13,102 |
| 2018 | $2,256 | $14,856 | $1,754 | $13,102 |
| 2017 | $1,599 | $10,801 | $1,525 | $9,276 |
| 2016 | $1,663 | $10,801 | $1,525 | $9,276 |
| 2015 | $1,499 | $10,801 | $1,525 | $9,276 |
| 2014 | $1,459 | $10,433 | $1,163 | $9,270 |
| 2013 | $1,419 | $10,433 | $1,163 | $9,270 |
Source: Public Records
Map
Nearby Homes
- 1457 W Rosemont Ave Unit G
- 1513 W Highland Ave
- 1542 W Highland Ave
- 1336 W Granville Ave Unit 2
- 1626 W Highland Ave Unit 1W
- 1331 W Granville Ave
- 1435 W Arthur Ave Unit 1
- 6447 N Glenwood Ave
- 1723 W Thome Ave
- 6321 N Hermitage Ave
- 1243 W Rosemont Ave Unit 12433
- 6316 N Magnolia Ave
- 6328 N Magnolia Ave
- 6414 N Paulina St Unit G
- 6335 N Magnolia Ave Unit G
- 1748 W Granville Ave Unit 2A
- 1221 W Granville Ave Unit 2B
- 1762 W Highland Ave Unit 104
- 6532 N Ashland Ave
- 6065 N Hermitage Ave
- 6257 N Greenview Ave Unit 6257
- 6257 N Greenview Ave Unit 6257
- 6257 N Greenview Ave Unit 3
- 6257 N Greenview Ave Unit 1
- 6257 N Greenview Ave Unit 2
- 1455 W Rosemont Ave Unit 1
- 1455 W Rosemont Ave Unit 14552
- 1455 W Rosemont Ave Unit 14551
- 1455 W Rosemont Ave Unit 14553
- 1455 W Rosemont Ave Unit 2
- 1455 W Rosemont Ave Unit 3
- 6255 N Greenview Ave Unit 6255
- 6253 N Greenview Ave Unit 6253
- 6255 N Greenview Ave Unit 6255
- 6253 N Greenview Ave Unit 6253
- 6253 N Greenview Ave Unit 6253
- 6255 N Greenview Ave Unit 6255
- 6253 N Greenview Ave Unit 2
- 6253 N Greenview Ave
- 6253 N Greenview Ave Unit 3