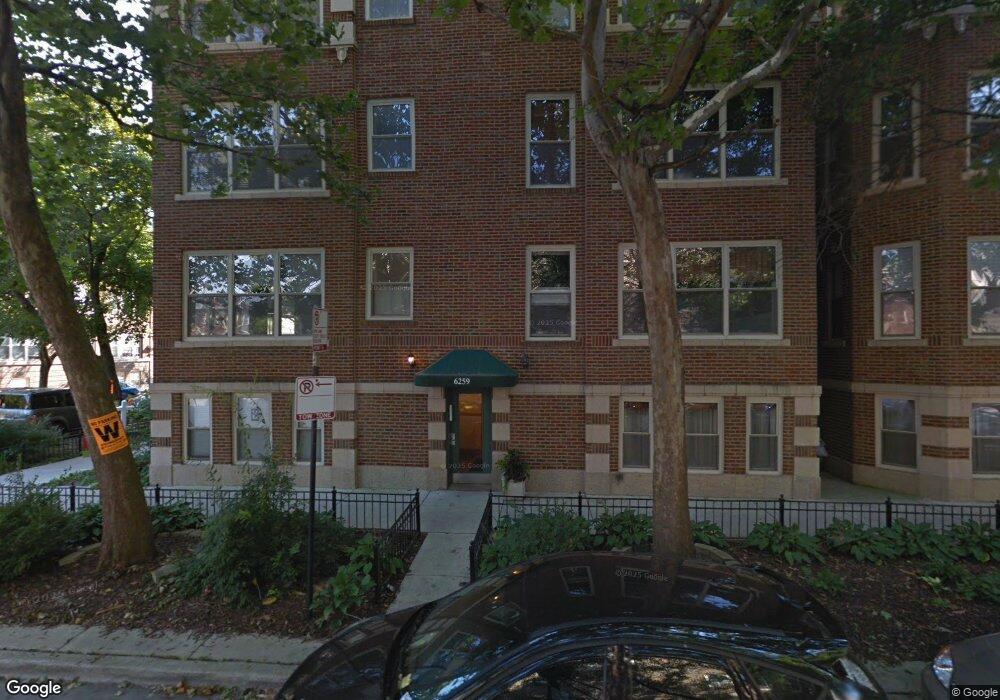
6259 N Magnolia Ave Unit 2 Chicago, IL 60660
Edgewater NeighborhoodEstimated Value: $338,000 - $416,000
2
Beds
1
Bath
1,200
Sq Ft
$311/Sq Ft
Est. Value
About This Home
This home is located at 6259 N Magnolia Ave Unit 2, Chicago, IL 60660 and is currently estimated at $373,439, approximately $311 per square foot. 6259 N Magnolia Ave Unit 2 is a home located in Cook County with nearby schools including Hayt Elementary School, Senn High School, and Northside Catholic Academy.
Ownership History
Date
Name
Owned For
Owner Type
Purchase Details
Closed on
Aug 31, 2017
Sold by
Castillo Melba A and Jung John
Bought by
Castillo Melba A and Jung John E
Current Estimated Value
Home Financials for this Owner
Home Financials are based on the most recent Mortgage that was taken out on this home.
Original Mortgage
$211,000
Outstanding Balance
$112,194
Interest Rate
3.49%
Mortgage Type
New Conventional
Estimated Equity
$261,245
Purchase Details
Closed on
May 6, 2010
Sold by
Ruhl John M
Bought by
Castillo Melba A
Home Financials for this Owner
Home Financials are based on the most recent Mortgage that was taken out on this home.
Original Mortgage
$237,737
Interest Rate
5.3%
Mortgage Type
New Conventional
Purchase Details
Closed on
Mar 20, 2002
Sold by
Albany Bank & Trust Company Na
Bought by
Ruhl John M
Home Financials for this Owner
Home Financials are based on the most recent Mortgage that was taken out on this home.
Original Mortgage
$161,990
Interest Rate
6.93%
Create a Home Valuation Report for This Property
The Home Valuation Report is an in-depth analysis detailing your home's value as well as a comparison with similar homes in the area
Home Values in the Area
Average Home Value in this Area
Purchase History
| Date | Buyer | Sale Price | Title Company |
|---|---|---|---|
| Castillo Melba A | -- | Plymouth Title Guaranty Corp | |
| Castillo Melba A | $250,500 | Cti | |
| Ruhl John M | $193,000 | Chicago Title Insurance Co |
Source: Public Records
Mortgage History
| Date | Status | Borrower | Loan Amount |
|---|---|---|---|
| Open | Castillo Melba A | $211,000 | |
| Closed | Castillo Melba A | $237,737 | |
| Previous Owner | Ruhl John M | $161,990 | |
| Closed | Ruhl John M | $40,498 |
Source: Public Records
Tax History Compared to Growth
Tax History
| Year | Tax Paid | Tax Assessment Tax Assessment Total Assessment is a certain percentage of the fair market value that is determined by local assessors to be the total taxable value of land and additions on the property. | Land | Improvement |
|---|---|---|---|---|
| 2024 | $5,052 | $28,697 | $5,218 | $23,479 |
| 2023 | $4,903 | $27,260 | $4,195 | $23,065 |
| 2022 | $4,903 | $27,260 | $4,195 | $23,065 |
| 2021 | $4,812 | $27,259 | $4,195 | $23,064 |
| 2020 | $3,679 | $19,618 | $2,412 | $17,206 |
| 2019 | $3,672 | $21,706 | $2,412 | $19,294 |
| 2018 | $3,609 | $21,706 | $2,412 | $19,294 |
| 2017 | $3,390 | $19,125 | $2,097 | $17,028 |
| 2016 | $3,330 | $19,125 | $2,097 | $17,028 |
| 2015 | $3,024 | $19,125 | $2,097 | $17,028 |
| 2014 | $3,288 | $20,289 | $1,599 | $18,690 |
| 2013 | $3,212 | $20,289 | $1,599 | $18,690 |
Source: Public Records
Map
Nearby Homes
- 1234 W Granville Ave
- 1134 W Granville Ave Unit 602
- 1243 W Rosemont Ave Unit 12433
- 1221 W Granville Ave Unit 2B
- 1265 W Granville Ave Unit 3
- 6328 N Magnolia Ave
- 6335 N Magnolia Ave Unit G
- 1331 W Granville Ave
- 6150 N Kenmore Ave Unit 15B
- 6300 N Sheridan Rd Unit 517
- 6300 N Sheridan Rd Unit 710
- 6300 N Sheridan Rd Unit 406
- 6342 N Sheridan Rd Unit 5B
- 6157 N Sheridan Rd Unit 5G
- 6157 N Sheridan Rd Unit 25A
- 1457 W Rosemont Ave Unit G
- 6118 N Sheridan Rd Unit 305
- 6118 N Sheridan Rd Unit 206
- 6118 N Sheridan Rd Unit 1003
- 6171 N Sheridan Rd Unit 1804
- 6259 N Magnolia Ave Unit 62593
- 6259 N Magnolia Ave Unit 6259G
- 6259 N Magnolia Ave Unit 62592
- 6259 N Magnolia Ave Unit 62591
- 6259 N Magnolia Ave Unit GRDN
- 6259 N Magnolia Ave Unit 1
- 6259 N Magnolia Ave Unit G
- 1221 W Rosemont Ave Unit 1
- 1221 W Rosemont Ave Unit 12213
- 1221 W Rosemont Ave Unit 12211
- 1219 W Rosemont Ave Unit 12191
- 1219 W Rosemont Ave Unit 1219G
- 1215 W Rosemont Ave Unit 1215G
- 1215 W Rosemont Ave Unit 12152
- 1219 W Rosemont Ave Unit 12192
- 1215 W Rosemont Ave Unit 12153
- 1215 W Rosemont Ave Unit 12151
- 1219 W Rosemont Ave Unit 12193
- 1221 W Rosemont Ave Unit 12212
- 1219 W Rosemont Ave Unit 1