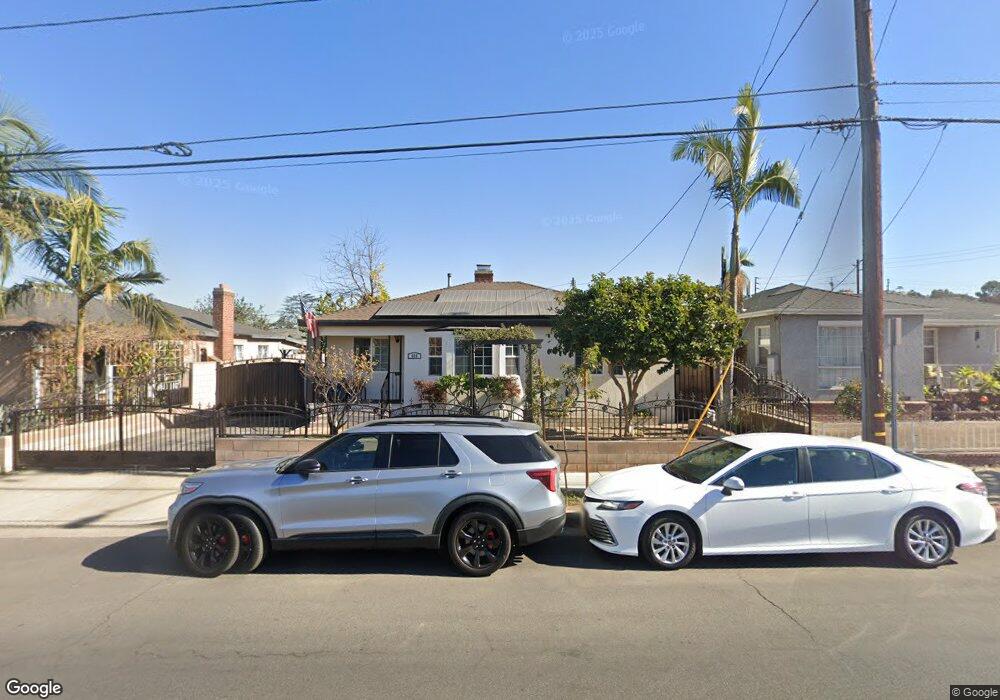
626 Glendora Ave La Puente, CA 91744
Estimated Value: $691,000 - $747,000
3
Beds
2
Baths
1,143
Sq Ft
$627/Sq Ft
Est. Value
About This Home
This home is located at 626 Glendora Ave, La Puente, CA 91744 and is currently estimated at $716,418, approximately $626 per square foot. 626 Glendora Ave is a home located in Los Angeles County with nearby schools including Del Valle Elementary School, Sierra Vista Middle School, and La Puente High School.
Ownership History
Date
Name
Owned For
Owner Type
Purchase Details
Closed on
Nov 20, 2020
Sold by
Lugo Rodolfo and Lugo Terry
Bought by
Lugo Rodolfo and Lugo Terry
Current Estimated Value
Home Financials for this Owner
Home Financials are based on the most recent Mortgage that was taken out on this home.
Original Mortgage
$50,000
Outstanding Balance
$44,493
Interest Rate
2.8%
Mortgage Type
Credit Line Revolving
Estimated Equity
$671,925
Purchase Details
Closed on
Feb 14, 2003
Sold by
Murillo Terry
Bought by
Lugo Rodolfo and Murillo Terry
Home Financials for this Owner
Home Financials are based on the most recent Mortgage that was taken out on this home.
Original Mortgage
$170,000
Interest Rate
5.85%
Purchase Details
Closed on
May 28, 1999
Sold by
Greenlee Kevin W
Bought by
Murillo Terry
Home Financials for this Owner
Home Financials are based on the most recent Mortgage that was taken out on this home.
Original Mortgage
$137,863
Interest Rate
7.2%
Mortgage Type
FHA
Create a Home Valuation Report for This Property
The Home Valuation Report is an in-depth analysis detailing your home's value as well as a comparison with similar homes in the area
Home Values in the Area
Average Home Value in this Area
Purchase History
| Date | Buyer | Sale Price | Title Company |
|---|---|---|---|
| Lugo Rodolfo | -- | Lawyers Title Company | |
| Lugo Rodolfo | -- | American Title Ins Co | |
| Murillo Terry | $139,000 | American Title Co |
Source: Public Records
Mortgage History
| Date | Status | Borrower | Loan Amount |
|---|---|---|---|
| Open | Lugo Rodolfo | $50,000 | |
| Closed | Lugo Rodolfo | $170,000 | |
| Closed | Murillo Terry | $137,863 |
Source: Public Records
Tax History
| Year | Tax Paid | Tax Assessment Tax Assessment Total Assessment is a certain percentage of the fair market value that is determined by local assessors to be the total taxable value of land and additions on the property. | Land | Improvement |
|---|---|---|---|---|
| 2025 | $3,043 | $217,883 | $132,456 | $85,427 |
| 2024 | $3,043 | $213,611 | $129,859 | $83,752 |
| 2023 | $2,969 | $209,423 | $127,313 | $82,110 |
| 2022 | $2,889 | $205,317 | $124,817 | $80,500 |
| 2021 | $2,836 | $201,292 | $122,370 | $78,922 |
| 2020 | $1,422 | $199,229 | $121,116 | $78,113 |
| 2019 | $2,759 | $195,324 | $118,742 | $76,582 |
| 2018 | $2,579 | $191,495 | $116,414 | $75,081 |
| 2016 | $2,395 | $184,061 | $111,895 | $72,166 |
| 2015 | $2,351 | $181,297 | $110,215 | $71,082 |
| 2014 | $2,321 | $177,747 | $108,057 | $69,690 |
Source: Public Records
Map
Nearby Homes
- 611 Santo Oro Ave
- 15865 Sierra Vista Ct
- 15625 Loukelton St
- 16060 Las Vecinas Dr
- 826 Del Valle Ave
- 902 Ballista Ave
- 209 N Stimson Ave
- 671 Peggy Ave
- 15509 Amar Rd
- 1023 Gilwood Ave
- 15739 Amar Rd
- 16003 Abbey St
- 226 Shay Ave
- 1084 Del Valle Ave
- 15426 Hayland St
- 138 Banbridge Ave
- 1069 Aileron Ave
- 16149 Abbey St
- 16142 Abbey St
- 15865 Cadwell St
- 622 Glendora Ave
- 632 Glendora Ave
- 616 Glendora Ave
- 638 Glendora Ave
- 610 Glendora Ave
- 644 Glendora Ave
- 15719 Temple Ave
- 15718 Montana Ave
- 15725 Temple Ave
- 15722 Montana Ave
- 625 Glendora Ave
- 15728 Montana Ave
- 604 Glendora Ave
- 619 Glendora Ave Unit A
- 15729 Temple Ave
- 665 Glendora Ave
- 621 N Stimson Ave
- 651 Glendora Ave
- 615 N Stimson Ave
- 661 Glendora Ave
Your Personal Tour Guide
Ask me questions while you tour the home.