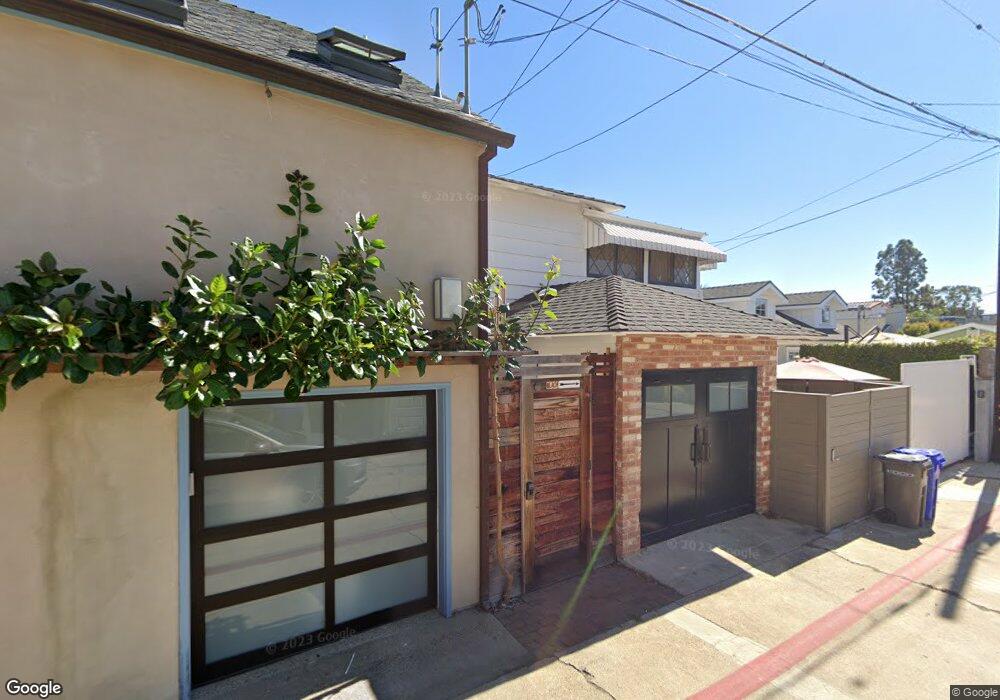
626 J Ave Coronado, CA 92118
Estimated Value: $2,234,813 - $3,043,000
2
Beds
1
Bath
1,132
Sq Ft
$2,286/Sq Ft
Est. Value
About This Home
This home is located at 626 J Ave, Coronado, CA 92118 and is currently estimated at $2,587,203, approximately $2,285 per square foot. 626 J Ave is a home located in San Diego County with nearby schools including Coronado Village Elementary, Coronado Middle School, and Coronado High School.
Ownership History
Date
Name
Owned For
Owner Type
Purchase Details
Closed on
Oct 2, 2020
Sold by
Rejent Moeller Mary E
Bought by
Rejent Moeller Mary and Moeller Family Trust
Current Estimated Value
Purchase Details
Closed on
May 1, 2012
Sold by
Miller William A and Miller Andra R
Bought by
Rejent Moeller Mary E
Purchase Details
Closed on
Jun 27, 2007
Sold by
Estate Of Nora R Sharp
Bought by
Miller William A and Miller Andra R
Create a Home Valuation Report for This Property
The Home Valuation Report is an in-depth analysis detailing your home's value as well as a comparison with similar homes in the area
Home Values in the Area
Average Home Value in this Area
Purchase History
| Date | Buyer | Sale Price | Title Company |
|---|---|---|---|
| Rejent Moeller Mary | -- | None Available | |
| Rejent Moeller Mary E | $1,062,000 | First American Title San Die | |
| Miller William A | $1,050,000 | First American Title |
Source: Public Records
Tax History
| Year | Tax Paid | Tax Assessment Tax Assessment Total Assessment is a certain percentage of the fair market value that is determined by local assessors to be the total taxable value of land and additions on the property. | Land | Improvement |
|---|---|---|---|---|
| 2025 | $13,372 | $1,410,886 | $1,004,839 | $406,047 |
| 2024 | $13,372 | $1,383,223 | $985,137 | $398,086 |
| 2023 | $13,218 | $1,356,102 | $965,821 | $390,281 |
| 2022 | $13,055 | $1,329,513 | $946,884 | $382,629 |
| 2021 | $12,860 | $1,303,445 | $928,318 | $375,127 |
| 2020 | $12,534 | $1,290,081 | $918,800 | $371,281 |
| 2019 | $12,504 | $1,264,786 | $900,785 | $364,001 |
| 2018 | $12,315 | $1,239,987 | $883,123 | $356,864 |
| 2017 | $12,094 | $1,215,674 | $865,807 | $349,867 |
| 2016 | $11,722 | $1,191,838 | $848,831 | $343,007 |
| 2015 | $11,518 | $1,173,936 | $836,081 | $337,855 |
| 2014 | $11,219 | $1,150,941 | $819,704 | $331,237 |
Source: Public Records
Map
Nearby Homes
Your Personal Tour Guide
Ask me questions while you tour the home.