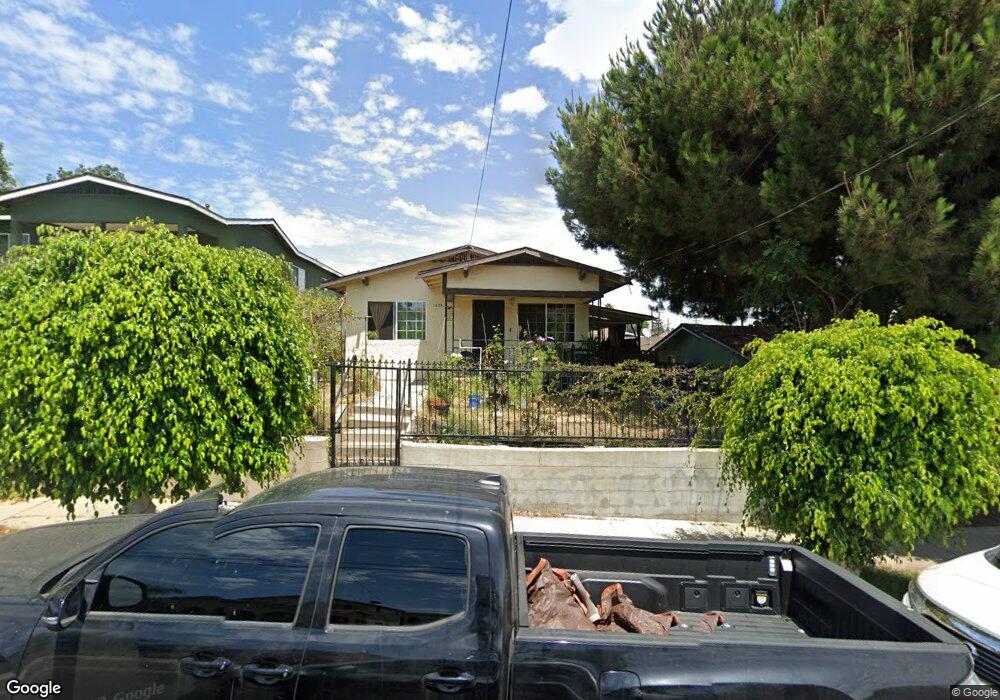
626 W 4th St San Pedro, CA 90731
Estimated Value: $675,000 - $723,000
3
Beds
2
Baths
1,284
Sq Ft
$553/Sq Ft
Est. Value
About This Home
This home is located at 626 W 4th St, San Pedro, CA 90731 and is currently estimated at $710,372, approximately $553 per square foot. 626 W 4th St is a home located in Los Angeles County with nearby schools including Cabrillo Avenue Elementary School, Dana Middle School, and San Pedro Senior High School.
Ownership History
Date
Name
Owned For
Owner Type
Purchase Details
Closed on
May 5, 2009
Sold by
Delcampo Jorge and Delcampo Del Campo
Bought by
Delcampo Francisco Serrato De and Delcampo Del Campo
Current Estimated Value
Home Financials for this Owner
Home Financials are based on the most recent Mortgage that was taken out on this home.
Original Mortgage
$157,000
Outstanding Balance
$98,446
Interest Rate
4.71%
Mortgage Type
New Conventional
Estimated Equity
$611,926
Purchase Details
Closed on
Feb 11, 1997
Sold by
Glendale Federal Bank Fsb
Bought by
Delcampo Jorge and Delcampo Francisca
Home Financials for this Owner
Home Financials are based on the most recent Mortgage that was taken out on this home.
Original Mortgage
$108,000
Interest Rate
7.66%
Purchase Details
Closed on
Oct 2, 1996
Sold by
Cubias Nelson F and Cubias Hugo F
Bought by
Glendale Federal Bank Fsb
Create a Home Valuation Report for This Property
The Home Valuation Report is an in-depth analysis detailing your home's value as well as a comparison with similar homes in the area
Home Values in the Area
Average Home Value in this Area
Purchase History
| Date | Buyer | Sale Price | Title Company |
|---|---|---|---|
| Delcampo Francisco Serrato De | -- | Lawyers Title Co | |
| Delcampo Jorge | $127,500 | Benefit Land Title Company | |
| Glendale Federal Bank Fsb | $134,599 | Fidelity National Title Ins |
Source: Public Records
Mortgage History
| Date | Status | Borrower | Loan Amount |
|---|---|---|---|
| Open | Delcampo Francisco Serrato De | $157,000 | |
| Closed | Delcampo Jorge | $108,000 |
Source: Public Records
Tax History
| Year | Tax Paid | Tax Assessment Tax Assessment Total Assessment is a certain percentage of the fair market value that is determined by local assessors to be the total taxable value of land and additions on the property. | Land | Improvement |
|---|---|---|---|---|
| 2025 | $2,618 | $207,630 | $166,113 | $41,517 |
| 2024 | $2,618 | $203,559 | $162,856 | $40,703 |
| 2023 | $2,570 | $199,568 | $159,663 | $39,905 |
| 2022 | $2,453 | $195,656 | $156,533 | $39,123 |
| 2021 | $2,417 | $191,820 | $153,464 | $38,356 |
| 2020 | $2,436 | $189,854 | $151,891 | $37,963 |
| 2019 | $2,345 | $186,132 | $148,913 | $37,219 |
| 2018 | $2,248 | $182,484 | $145,994 | $36,490 |
| 2017 | $2,196 | $178,907 | $143,132 | $35,775 |
| 2016 | $2,133 | $175,400 | $140,326 | $35,074 |
| 2015 | $2,102 | $172,767 | $138,219 | $34,548 |
| 2014 | $2,098 | $169,384 | $135,512 | $33,872 |
Source: Public Records
Map
Nearby Homes
Your Personal Tour Guide
Ask me questions while you tour the home.