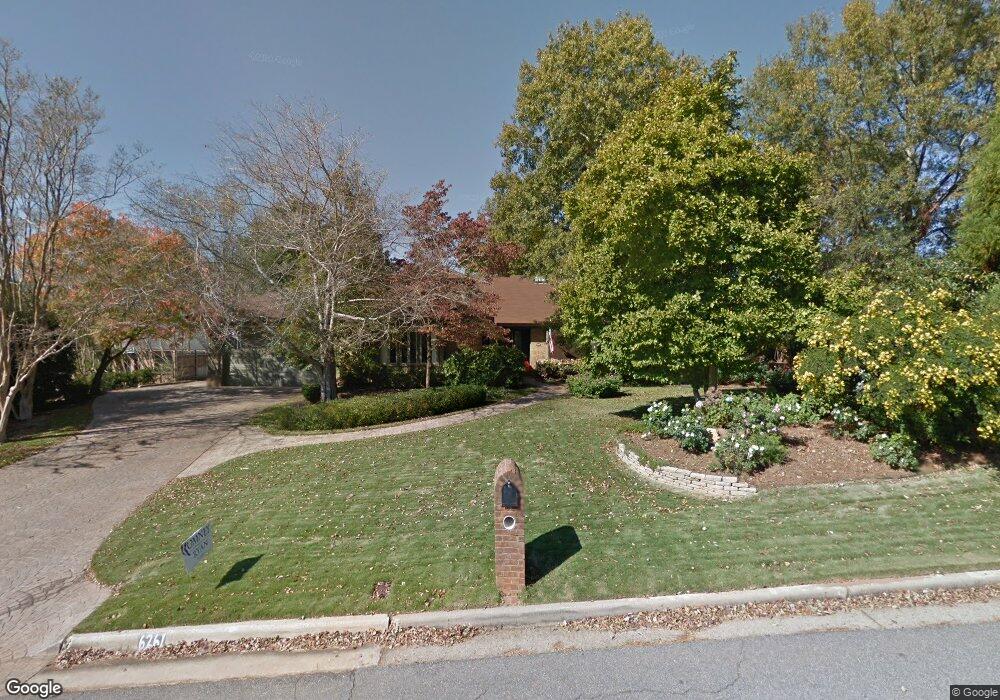
6261 Seminary Rd Columbus, GA 31904
Estimated Value: $222,806 - $426,000
3
Beds
4
Baths
4,956
Sq Ft
$73/Sq Ft
Est. Value
About This Home
This home is located at 6261 Seminary Rd, Columbus, GA 31904 and is currently estimated at $361,952, approximately $73 per square foot. 6261 Seminary Rd is a home located in Muscogee County with nearby schools including River Road Elementary School, Double Churches Middle School, and Northside High School.
Ownership History
Date
Name
Owned For
Owner Type
Purchase Details
Closed on
Apr 29, 2020
Sold by
Nguyen Tom
Bought by
Nguyen Tom and Doan Nhi
Current Estimated Value
Home Financials for this Owner
Home Financials are based on the most recent Mortgage that was taken out on this home.
Original Mortgage
$256,500
Outstanding Balance
$227,295
Interest Rate
3.3%
Estimated Equity
$134,657
Purchase Details
Closed on
Apr 27, 2020
Sold by
First Tennessee Bank National Associatio
Bought by
Nguyen Tom
Home Financials for this Owner
Home Financials are based on the most recent Mortgage that was taken out on this home.
Original Mortgage
$256,500
Outstanding Balance
$227,295
Interest Rate
3.3%
Estimated Equity
$134,657
Purchase Details
Closed on
Nov 15, 2019
Sold by
Live Well Financial Inc
Bought by
First Tennessee Bank and C/O Celink
Purchase Details
Closed on
Jan 2, 2019
Sold by
Fleming Alan K
Bought by
Live Well Financial Inc
Purchase Details
Closed on
Sep 14, 2017
Sold by
Fleming Gloria Cole
Bought by
Fleming Alan K
Create a Home Valuation Report for This Property
The Home Valuation Report is an in-depth analysis detailing your home's value as well as a comparison with similar homes in the area
Home Values in the Area
Average Home Value in this Area
Purchase History
| Date | Buyer | Sale Price | Title Company |
|---|---|---|---|
| Nguyen Tom | -- | -- | |
| Nguyen Tom | -- | -- | |
| First Tennessee Bank | -- | -- | |
| Live Well Financial Inc | $400,000 | -- | |
| Fleming Alan K | -- | -- |
Source: Public Records
Mortgage History
| Date | Status | Borrower | Loan Amount |
|---|---|---|---|
| Open | Nguyen Tom | $256,500 |
Source: Public Records
Tax History Compared to Growth
Tax History
| Year | Tax Paid | Tax Assessment Tax Assessment Total Assessment is a certain percentage of the fair market value that is determined by local assessors to be the total taxable value of land and additions on the property. | Land | Improvement |
|---|---|---|---|---|
| 2025 | $3,712 | $153,328 | $24,668 | $128,660 |
| 2024 | $3,710 | $38,548 | $24,668 | $13,880 |
| 2023 | $3,040 | $223,420 | $24,668 | $198,752 |
| 2022 | $3,870 | $193,240 | $24,668 | $168,572 |
| 2021 | $3,863 | $108,000 | $14,680 | $93,320 |
| 2020 | $7,256 | $177,672 | $24,668 | $153,004 |
| 2019 | $5,982 | $177,672 | $24,668 | $153,004 |
| 2018 | $5,982 | $177,672 | $24,668 | $153,004 |
| 2017 | $6,003 | $177,672 | $24,668 | $153,004 |
| 2016 | $6,026 | $159,355 | $11,066 | $148,289 |
| 2015 | $2,414 | $159,355 | $11,066 | $148,289 |
| 2014 | $6,042 | $159,355 | $11,066 | $148,289 |
| 2013 | $6,051 | $159,355 | $11,066 | $148,289 |
Source: Public Records
Map
Nearby Homes
- 6333 Cape Cod Dr
- 5 Bridgecreek Ct
- 6390 Cape Cod Dr
- 6130 Brookstone Blvd
- 6130 Bristol Blvd
- 5908 Brookstone Blvd
- 521 Newport Place
- 616 Newport Place
- 438 Newport Place
- 6101 River Rd Unit 2
- 235 Pebblebrook Ln
- 7233 Mobley Walk Dr
- 223 Pebblebrook Ln
- 239 Clearbrook Ln
- 280 Zachary Ct
- 7015 Spring Walk Dr
- 7020 Redwood Dr
- 6836 Sharmel Ln
- 7044 Spring Walk Dr
- 6969 Mobley Rd
- 6253 Seminary Rd
- 6363 Cape Cod Dr
- 6260 Seminary Rd
- 6236 Brookstone Blvd
- 6245 Seminary Rd
- 6252 Seminary Rd
- 6341 Cape Cod Dr
- 6626 Seminary Rd
- 6367 Cape Cod Dr
- 6260 Brookstone Blvd
- 6224 Brookstone Blvd
- 6244 Seminary Rd
- 6366 Cape Cod Dr
- 6237 Seminary Rd
- 0 Brookstone Blvd Unit 7475152
- 6272 Brookstone Blvd
- 6370 Cape Cod Dr
- 6358 Cape Cod Dr
- 6325 Cape Cod Dr
- 6374 Cape Cod Dr