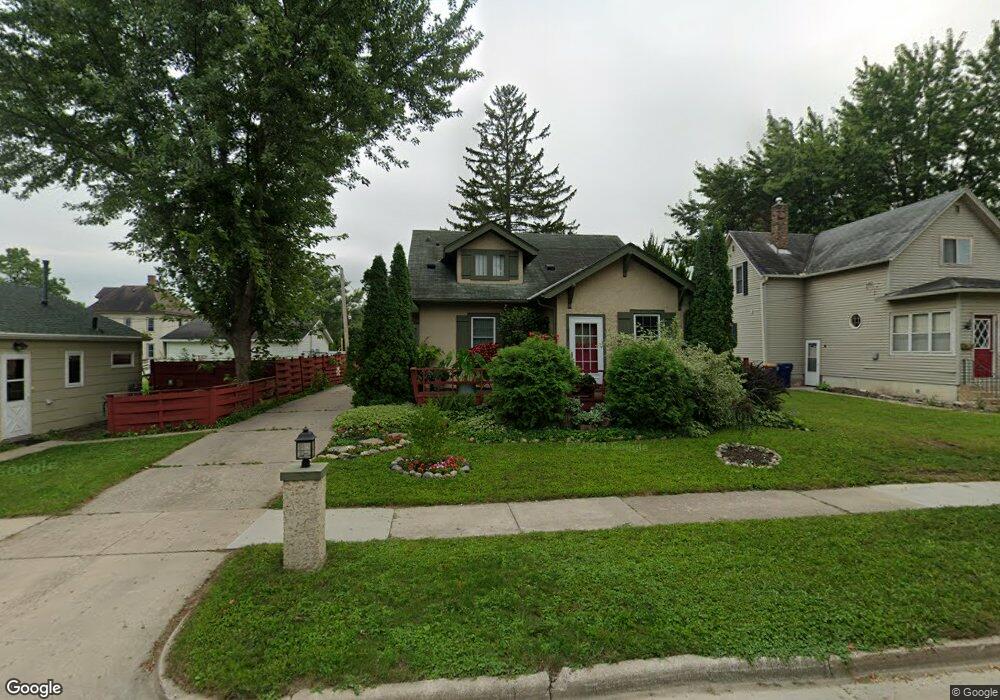
627 3rd St Kenyon, MN 55946
Estimated Value: $215,000 - $248,000
4
Beds
3
Baths
1,649
Sq Ft
$141/Sq Ft
Est. Value
About This Home
This home is located at 627 3rd St, Kenyon, MN 55946 and is currently estimated at $233,045, approximately $141 per square foot. 627 3rd St is a home located in Goodhue County with nearby schools including Kenyon-Wanamingo Elementary School, Kenyon-Wanamingo Middle School, and Kenyon-Wanamingo Senior High School.
Ownership History
Date
Name
Owned For
Owner Type
Purchase Details
Closed on
Oct 9, 2020
Sold by
Althoff James and Althoff Debra
Bought by
Third Street Townhomes
Current Estimated Value
Purchase Details
Closed on
Oct 7, 2011
Sold by
Brinkhaus Greg
Bought by
Brinkhaus David
Purchase Details
Closed on
May 24, 2007
Sold by
Stevenson David A and Stevenson Carrie S
Bought by
Brinkhaus David and Brinkhaus Rebecca
Create a Home Valuation Report for This Property
The Home Valuation Report is an in-depth analysis detailing your home's value as well as a comparison with similar homes in the area
Purchase History
| Date | Buyer | Sale Price | Title Company |
|---|---|---|---|
| Third Street Townhomes | -- | None Available | |
| Brinkhaus David | $18,000 | -- | |
| Brinkhaus David | $174,700 | -- |
Source: Public Records
Tax History
| Year | Tax Paid | Tax Assessment Tax Assessment Total Assessment is a certain percentage of the fair market value that is determined by local assessors to be the total taxable value of land and additions on the property. | Land | Improvement |
|---|---|---|---|---|
| 2025 | -- | $193,600 | $29,300 | $164,300 |
| 2024 | -- | $188,900 | $29,300 | $159,600 |
| 2023 | $2,776 | $176,500 | $29,300 | $147,200 |
| 2022 | $2,660 | $173,800 | $29,300 | $144,500 |
| 2021 | $2,442 | $147,100 | $26,800 | $120,300 |
| 2020 | $2,430 | $144,700 | $26,800 | $117,900 |
| 2019 | $2,098 | $144,600 | $26,800 | $117,800 |
| 2018 | $2,002 | $118,700 | $17,900 | $100,800 |
| 2017 | $1,852 | $115,000 | $17,900 | $97,100 |
| 2016 | $1,680 | $107,900 | $17,900 | $90,000 |
| 2015 | $1,660 | $98,400 | $17,900 | $80,500 |
| 2014 | -- | $94,800 | $15,300 | $79,500 |
Source: Public Records
Map
Nearby Homes
Your Personal Tour Guide
Ask me questions while you tour the home.