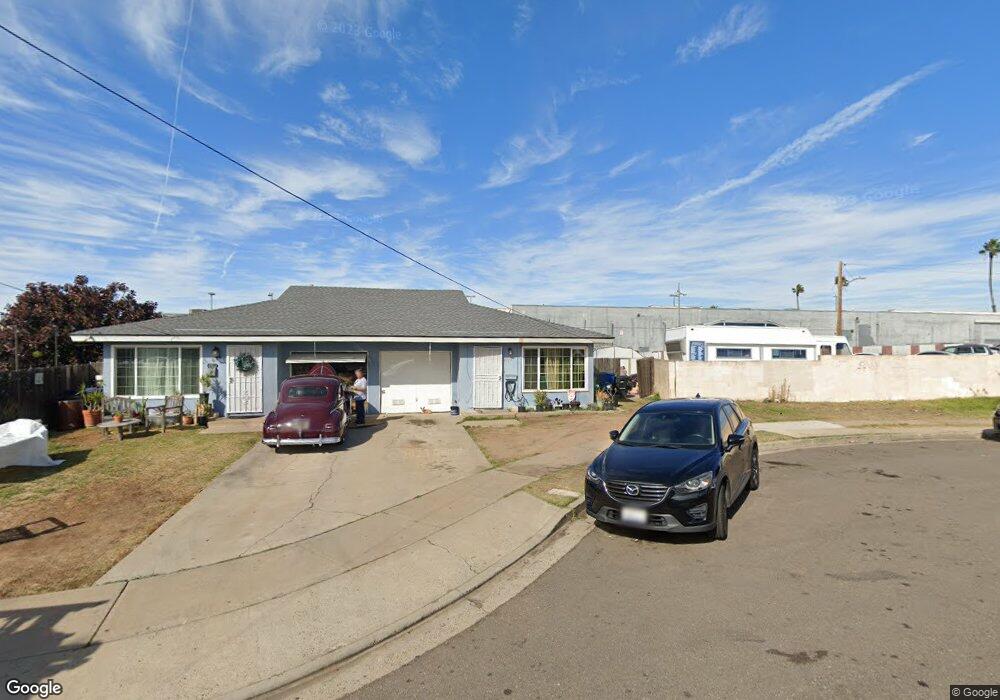
627 Mankato St Unit 29 Chula Vista, CA 91910
Downtown Chula Vista NeighborhoodEstimated Value: $760,486 - $886,000
4
Beds
2
Baths
1,629
Sq Ft
$507/Sq Ft
Est. Value
About This Home
This home is located at 627 Mankato St Unit 29, Chula Vista, CA 91910 and is currently estimated at $825,122, approximately $506 per square foot. 627 Mankato St Unit 29 is a home located in San Diego County with nearby schools including Chula Vista Middle School, Chula Vista High School, and Mueller Charter School.
Ownership History
Date
Name
Owned For
Owner Type
Purchase Details
Closed on
Aug 31, 2021
Sold by
Mendillo Mark and Mendillo Mary Alice
Bought by
Mendillo Mark and Mendillo Mary Alice
Current Estimated Value
Purchase Details
Closed on
Aug 24, 1998
Sold by
Humphries James C and Humphries Mitsuko
Bought by
Humphries James C and Humphries Mitsuko
Home Financials for this Owner
Home Financials are based on the most recent Mortgage that was taken out on this home.
Original Mortgage
$115,200
Interest Rate
6.91%
Purchase Details
Closed on
Jul 1, 1998
Sold by
Humphries Intervivos Trust 01-23-90 and James C
Bought by
Mendillo Mark and Mendillo Mary Alice
Home Financials for this Owner
Home Financials are based on the most recent Mortgage that was taken out on this home.
Original Mortgage
$115,200
Interest Rate
6.91%
Purchase Details
Closed on
Jun 13, 1992
Sold by
Humphries James C and Humphries Mitsuko
Bought by
The Humphries Intervivos Trust
Create a Home Valuation Report for This Property
The Home Valuation Report is an in-depth analysis detailing your home's value as well as a comparison with similar homes in the area
Home Values in the Area
Average Home Value in this Area
Purchase History
| Date | Buyer | Sale Price | Title Company |
|---|---|---|---|
| Mendillo Mark | -- | None Available | |
| Humphries James C | -- | Fidelity National Title | |
| Mendillo Mark | $136,727 | Fidelity National Title | |
| The Humphries Intervivos Trust | -- | -- |
Source: Public Records
Mortgage History
| Date | Status | Borrower | Loan Amount |
|---|---|---|---|
| Previous Owner | Mendillo Mark | $115,200 |
Source: Public Records
Tax History Compared to Growth
Tax History
| Year | Tax Paid | Tax Assessment Tax Assessment Total Assessment is a certain percentage of the fair market value that is determined by local assessors to be the total taxable value of land and additions on the property. | Land | Improvement |
|---|---|---|---|---|
| 2025 | $2,622 | $225,722 | $85,729 | $139,993 |
| 2024 | $2,622 | $221,298 | $84,049 | $137,249 |
| 2023 | $2,585 | $216,959 | $82,401 | $134,558 |
| 2022 | $2,511 | $212,706 | $80,786 | $131,920 |
| 2021 | $2,454 | $208,536 | $79,202 | $129,334 |
| 2020 | $2,395 | $206,398 | $78,390 | $128,008 |
| 2019 | $2,334 | $202,352 | $76,853 | $125,499 |
| 2018 | $2,298 | $198,386 | $75,347 | $123,039 |
| 2017 | $10 | $194,497 | $73,870 | $120,627 |
| 2016 | $2,197 | $190,684 | $72,422 | $118,262 |
| 2015 | $2,166 | $187,821 | $71,335 | $116,486 |
| 2014 | $2,131 | $184,143 | $69,938 | $114,205 |
Source: Public Records
Map
Nearby Homes
- 587 Jefferson Ave
- 622 I St
- 708 H St Unit 7
- 708 H St Unit 25
- 708 H St Unit 21
- 708 H St Unit 64
- 708 H St Unit 35
- 685 Jefferson Ave
- 658 Cedar Ave
- 429 Woodlawn Ave Unit D
- Plan1 at Citrus Bay - The Courts
- Plan 2 at Citrus Bay - The Courts
- Plan 3 at Citrus Bay - The Courts
- Plan 6 at Citrus Bay - The Towns
- Plan 4 at Citrus Bay - The Towns
- Plan 2 at Citrus Bay - The Towns
- Plan 5 at Citrus Bay - The Towns
- Plan 3 at Citrus Bay - The Towns
- Plan 1 at Citrus Bay - The Towns
- 691 G St
- 553 Madison Ave Unit 55
- 626 Mankato St Unit 28
- 567 Madison Ave Unit 69
- 618 Mankato St Unit 20
- 622 Mankato St Unit 24
- 550 Madison Ave Unit 52
- 554 Madison Ave Unit 56
- 560 Madison Ave Unit 62
- 627 Whitney St Unit 29
- 623 Whitney St Unit 25
- 573 Madison Ave Unit 75
- 560 Broadway
- 556 Madison Ave
- 566 Madison Ave Unit 68
- 619 Whitney St Unit 21
- 551 Jefferson Ave
- 570 Madison Ave Unit 72
- 557 Jefferson Ave
- 547 Jefferson Ave
- 561 Jefferson Ave