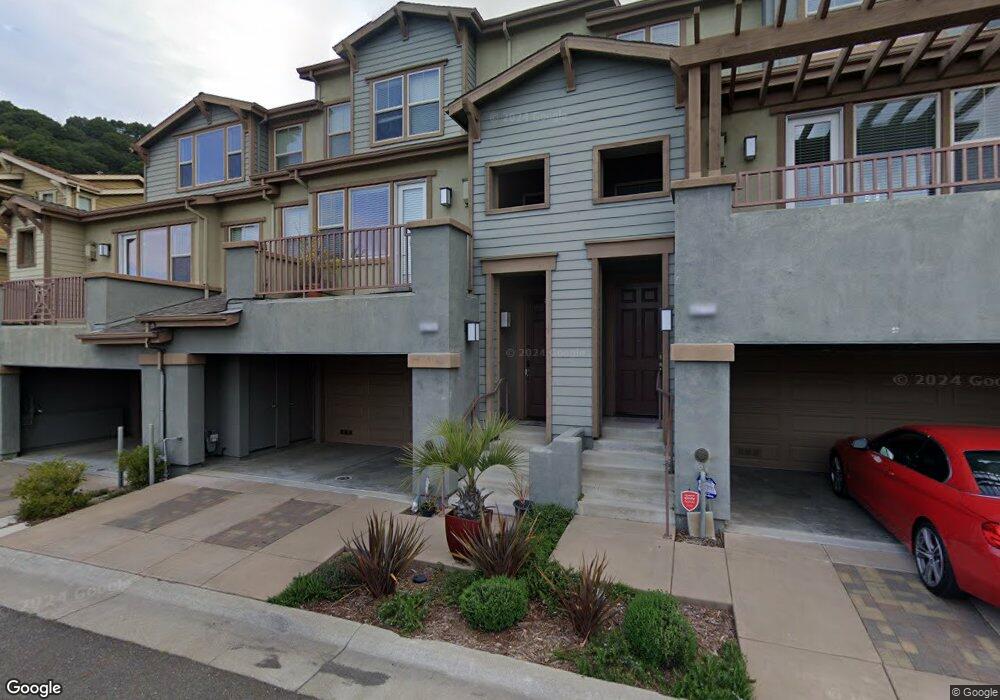
6270 Rocky Point Ct Oakland, CA 94605
Caballo Hills NeighborhoodEstimated Value: $826,000 - $921,000
3
Beds
3
Baths
2,269
Sq Ft
$390/Sq Ft
Est. Value
About This Home
This home is located at 6270 Rocky Point Ct, Oakland, CA 94605 and is currently estimated at $884,022, approximately $389 per square foot. 6270 Rocky Point Ct is a home located in Alameda County with nearby schools including Burckhalter Elementary School, Frick United Academy of Language, and Skyline High School.
Ownership History
Date
Name
Owned For
Owner Type
Purchase Details
Closed on
Oct 23, 2021
Sold by
Chang Annie
Bought by
Chang Annie and Danny And Annie Chang Family T
Current Estimated Value
Purchase Details
Closed on
Oct 15, 2021
Sold by
Chang Annie and Truong Helen
Bought by
Chang Annie
Purchase Details
Closed on
Oct 15, 2010
Sold by
Chang Danny
Bought by
Chang Annie
Home Financials for this Owner
Home Financials are based on the most recent Mortgage that was taken out on this home.
Original Mortgage
$473,622
Outstanding Balance
$311,903
Interest Rate
4.31%
Mortgage Type
FHA
Estimated Equity
$572,119
Purchase Details
Closed on
Jan 4, 2010
Sold by
Seeno Albert D and Seeno Iii Revocable T Albert D
Bought by
Sky Chi 8 Llc
Home Financials for this Owner
Home Financials are based on the most recent Mortgage that was taken out on this home.
Original Mortgage
$9,600,000
Interest Rate
4.92%
Mortgage Type
Purchase Money Mortgage
Purchase Details
Closed on
Sep 17, 2009
Sold by
Leona Llc
Bought by
Pyramid Land Investment Llc
Create a Home Valuation Report for This Property
The Home Valuation Report is an in-depth analysis detailing your home's value as well as a comparison with similar homes in the area
Home Values in the Area
Average Home Value in this Area
Purchase History
| Date | Buyer | Sale Price | Title Company |
|---|---|---|---|
| Chang Annie | -- | None Available | |
| Chang Annie | -- | None Available | |
| Chang Annie | -- | Old Republic Title Company | |
| Chang Annie | $481,000 | Old Republic Title Company | |
| Sky Chi 8 Llc | -- | Old Republic Title Company | |
| Seeno Albert D | -- | Old Republic Title Company | |
| Pyramid Land Investment Llc | -- | Old Republic Title Company |
Source: Public Records
Mortgage History
| Date | Status | Borrower | Loan Amount |
|---|---|---|---|
| Open | Chang Annie | $473,622 | |
| Previous Owner | Seeno Albert D | $9,600,000 |
Source: Public Records
Tax History Compared to Growth
Tax History
| Year | Tax Paid | Tax Assessment Tax Assessment Total Assessment is a certain percentage of the fair market value that is determined by local assessors to be the total taxable value of land and additions on the property. | Land | Improvement |
|---|---|---|---|---|
| 2025 | $9,332 | $608,696 | $184,734 | $430,962 |
| 2024 | $9,332 | $596,628 | $181,113 | $422,515 |
| 2023 | $9,787 | $591,795 | $177,563 | $414,232 |
| 2022 | $9,525 | $573,194 | $174,082 | $406,112 |
| 2021 | $9,100 | $561,818 | $170,669 | $398,149 |
| 2020 | $9,000 | $562,989 | $168,920 | $394,069 |
| 2019 | $10,201 | $551,954 | $165,609 | $386,345 |
| 2018 | $9,965 | $541,135 | $162,363 | $378,772 |
| 2017 | $9,575 | $530,528 | $159,180 | $371,348 |
| 2016 | $9,247 | $520,128 | $156,060 | $364,068 |
| 2015 | $9,163 | $512,319 | $153,717 | $358,602 |
| 2014 | $9,223 | $502,284 | $150,706 | $351,578 |
Source: Public Records
Map
Nearby Homes
- 6264 Rocky Point Ct
- 6472 Bayview Dr
- 6019 Old Quarry Loop
- 6136 Old Quarry Loop Unit 4401
- 6443 Blue Rock Ct
- 6071 Old Quarry Loop
- 6042 Old Quarry Loop Unit 405
- 6063 Old Quarry Loop
- 7308 Altura Place
- 7400 Mountain Blvd Unit 11
- 7548 Altura Place
- 7415 Circle Hill Dr
- 7572 Mountain Blvd Unit 2
- 7620 Mountain Blvd Unit 12
- 6440 Sunnymere Ave
- 13407 Campus Dr
- 6432 Sunnymere Ave
- 13462 Campus Dr
- 3939 Edgemoor Place
- 3932 Gardenia Place
- 6268 Rocky Point Ct
- 6274 Rocky Point Ct
- 6266 Rocky Point Ct
- 6276 Rocky Point Ct
- 6473 Bayview Dr
- 6471 Bayview Dr
- 6475 Bayview Dr
- 6469 Bayview Dr
- 6269 Rocky Point Ct
- 6271 Rocky Point Ct
- 6262 Rocky Point Ct
- 6278 Rocky Point Ct
- 6467 Bayview Dr
- 6477 Bayview Dr
- 6267 Rocky Point Ct
- 6273 Rocky Point Ct
- 6265 Rocky Point Ct
- 6280 Rocky Point Ct
- 6275 Rocky Point Ct
- 6465 Bayview Dr