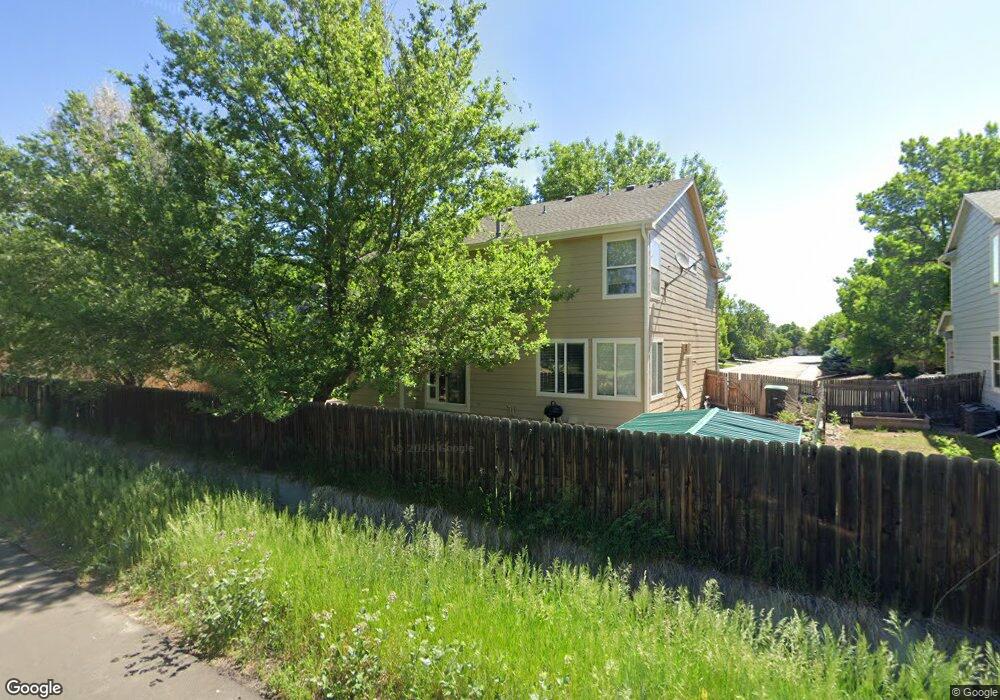
628 Bluegrass Dr Longmont, CO 80503
Schlagel NeighborhoodEstimated Value: $548,795 - $597,000
3
Beds
3
Baths
1,345
Sq Ft
$428/Sq Ft
Est. Value
About This Home
This home is located at 628 Bluegrass Dr, Longmont, CO 80503 and is currently estimated at $575,449, approximately $427 per square foot. 628 Bluegrass Dr is a home located in Boulder County with nearby schools including Indian Peaks Elementary School, Sunset Middle School, and Niwot High School.
Ownership History
Date
Name
Owned For
Owner Type
Purchase Details
Closed on
Nov 12, 2016
Sold by
Imhoff Justin
Bought by
Imhoff Justin
Current Estimated Value
Home Financials for this Owner
Home Financials are based on the most recent Mortgage that was taken out on this home.
Original Mortgage
$237,500
Outstanding Balance
$190,971
Interest Rate
3.47%
Mortgage Type
New Conventional
Estimated Equity
$384,478
Purchase Details
Closed on
Jul 24, 2009
Sold by
Chtourou Michael J
Bought by
Imhoff Justin
Home Financials for this Owner
Home Financials are based on the most recent Mortgage that was taken out on this home.
Original Mortgage
$217,490
Interest Rate
5.26%
Mortgage Type
FHA
Purchase Details
Closed on
Feb 27, 1997
Sold by
Kaufman & Broad Of Colorado Inc
Bought by
Chtourou Michael J
Home Financials for this Owner
Home Financials are based on the most recent Mortgage that was taken out on this home.
Original Mortgage
$138,500
Interest Rate
7.88%
Create a Home Valuation Report for This Property
The Home Valuation Report is an in-depth analysis detailing your home's value as well as a comparison with similar homes in the area
Home Values in the Area
Average Home Value in this Area
Purchase History
| Date | Buyer | Sale Price | Title Company |
|---|---|---|---|
| Imhoff Justin | -- | Land Title Guarantee | |
| Imhoff Justin | $225,000 | Guardian Title | |
| Chtourou Michael J | $153,934 | -- |
Source: Public Records
Mortgage History
| Date | Status | Borrower | Loan Amount |
|---|---|---|---|
| Open | Imhoff Justin | $237,500 | |
| Previous Owner | Imhoff Justin | $217,490 | |
| Previous Owner | Chtourou Michael J | $138,500 |
Source: Public Records
Tax History Compared to Growth
Tax History
| Year | Tax Paid | Tax Assessment Tax Assessment Total Assessment is a certain percentage of the fair market value that is determined by local assessors to be the total taxable value of land and additions on the property. | Land | Improvement |
|---|---|---|---|---|
| 2025 | $3,096 | $34,231 | $12,425 | $21,806 |
| 2024 | $3,096 | $34,231 | $12,425 | $21,806 |
| 2023 | $3,054 | $32,368 | $11,229 | $24,824 |
| 2022 | $2,723 | $27,515 | $9,862 | $17,653 |
| 2021 | $2,758 | $28,307 | $10,146 | $18,161 |
| 2020 | $2,657 | $27,349 | $7,508 | $19,841 |
| 2019 | $2,615 | $27,349 | $7,508 | $19,841 |
| 2018 | $2,142 | $22,550 | $6,048 | $16,502 |
| 2017 | $2,113 | $24,930 | $6,686 | $18,244 |
| 2016 | $2,037 | $21,309 | $8,995 | $12,314 |
| 2015 | $1,941 | $17,870 | $3,821 | $14,049 |
| 2014 | $1,669 | $17,870 | $3,821 | $14,049 |
Source: Public Records
Map
Nearby Homes
- 713 Nelson Park Cir
- 690 Stonebridge Dr
- 1004 Chokecherry Ln
- 2890 S Flat Cir
- 1108 Chokecherry Ln
- Fleming Plan at Mountain Brook - 80' Homesites
- Cypress Plan at Mountain Brook - 80' Homesites
- Foothills Plan at Mountain Brook - Townhomes
- Yukon Plan at Mountain Brook - 80' Homesites
- Sierra Plan at Mountain Brook
- Cimarron Plan at Mountain Brook - 40' Homesites
- Timberline Plan at Mountain Brook - Townhomes
- Riverbend Plan at Mountain Brook - 80' Homesites
- Grand Mesa Plan at Mountain Brook - 40' Homesites
- El Dorado Plan at Mountain Brook - 40' Homesites
- Terrain Plan at Mountain Brook - Townhomes
- Roxborough Plan at Mountain Brook - 40' Homesites
- Ridgeline Plan at Mountain Brook - Townhomes
- Summit Plan at Mountain Brook - 80' Homesites
- Silverthorne Plan at Mountain Brook
- 624 Bluegrass Dr
- 632 Bluegrass Dr
- 620 Bluegrass Dr
- 641 Nelson Park Dr
- 650 Nelson Park Dr
- 645 Nelson Park Dr
- 616 Bluegrass Dr
- 649 Timothy Dr
- 654 Nelson Park Dr
- 649 Nelson Park Dr
- 612 Bluegrass Dr
- 653 Timothy Dr
- 8979 Nelson Rd
- 658 Nelson Park Dr
- 8969 Nelson Rd
- 653 Nelson Park Dr
- 657 Timothy Dr
- 9799 N 89th St
- 9799 N 89th St Unit 11
- 648 Timothy Dr