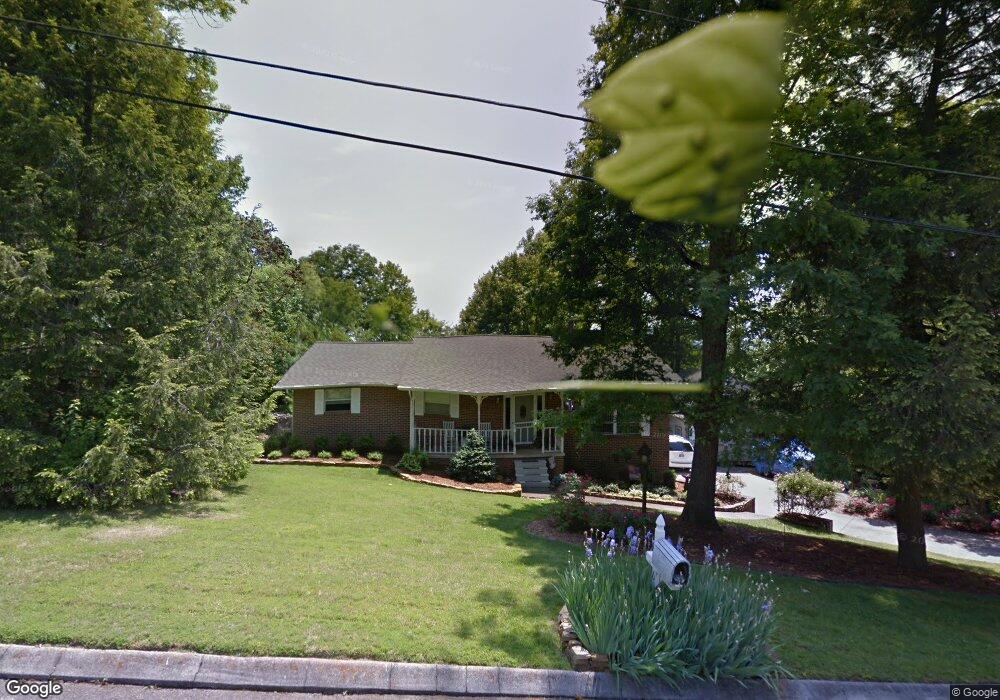
628 Crestview Ct Seymour, TN 37865
Estimated Value: $343,179 - $434,000
--
Bed
2
Baths
1,581
Sq Ft
$242/Sq Ft
Est. Value
About This Home
This home is located at 628 Crestview Ct, Seymour, TN 37865 and is currently estimated at $382,295, approximately $241 per square foot. 628 Crestview Ct is a home located in Blount County with nearby schools including Prospect Elementary School, Heritage Middle School, and Heritage High School.
Ownership History
Date
Name
Owned For
Owner Type
Purchase Details
Closed on
Jul 31, 2020
Sold by
Duncan Melanie Katherine
Bought by
Pohanka Thomas R and Pohanka Debbie
Current Estimated Value
Purchase Details
Closed on
Feb 1, 1999
Sold by
Dunn Martin T
Bought by
Pohanka Debbie
Home Financials for this Owner
Home Financials are based on the most recent Mortgage that was taken out on this home.
Original Mortgage
$81,600
Interest Rate
6.8%
Purchase Details
Closed on
Oct 10, 1997
Sold by
Dunn Martin T
Bought by
Todd Troutt C
Home Financials for this Owner
Home Financials are based on the most recent Mortgage that was taken out on this home.
Original Mortgage
$22,700
Interest Rate
7.39%
Purchase Details
Closed on
Aug 1, 1996
Sold by
Roberts David Phillip
Bought by
Dunn Martin
Purchase Details
Closed on
Jan 14, 1993
Bought by
Roberts David Phillip and Lee Anne
Purchase Details
Closed on
May 23, 1980
Bought by
Voorman Henry and Voorman Patricia
Create a Home Valuation Report for This Property
The Home Valuation Report is an in-depth analysis detailing your home's value as well as a comparison with similar homes in the area
Home Values in the Area
Average Home Value in this Area
Purchase History
| Date | Buyer | Sale Price | Title Company |
|---|---|---|---|
| Pohanka Thomas R | $220,000 | -- | |
| Pohanka Debbie | $102,000 | -- | |
| Todd Troutt C | $102,862 | -- | |
| Dunn Martin | $97,500 | -- | |
| Roberts David Phillip | $89,000 | -- | |
| Voorman Henry | -- | -- |
Source: Public Records
Mortgage History
| Date | Status | Borrower | Loan Amount |
|---|---|---|---|
| Previous Owner | Voorman Henry | $81,600 | |
| Previous Owner | Voorman Henry | $22,700 |
Source: Public Records
Tax History Compared to Growth
Tax History
| Year | Tax Paid | Tax Assessment Tax Assessment Total Assessment is a certain percentage of the fair market value that is determined by local assessors to be the total taxable value of land and additions on the property. | Land | Improvement |
|---|---|---|---|---|
| 2025 | $1,301 | $81,800 | $0 | $0 |
| 2024 | $1,301 | $81,800 | $11,250 | $70,550 |
| 2023 | $1,301 | $81,800 | $11,250 | $70,550 |
| 2022 | $1,175 | $47,575 | $7,500 | $40,075 |
| 2021 | $1,175 | $47,575 | $7,500 | $40,075 |
| 2020 | $1,175 | $47,575 | $7,500 | $40,075 |
| 2019 | $1,170 | $47,575 | $7,500 | $40,075 |
| 2018 | $963 | $38,975 | $5,000 | $33,975 |
| 2017 | $963 | $38,975 | $5,000 | $33,975 |
| 2016 | $963 | $38,975 | $5,000 | $33,975 |
| 2015 | $838 | $38,975 | $5,000 | $33,975 |
| 2014 | $861 | $38,975 | $5,000 | $33,975 |
| 2013 | $861 | $40,050 | $0 | $0 |
Source: Public Records
Map
Nearby Homes
- 634 Crestview Ct
- 862 Hinkle Estates Dr
- 830 Easey St
- 827 Hinkle Estates Dr
- 802 Hinkle Rd
- 715 Winston Dr
- 0 Miller Cir
- 516 Cherokee Hills Rd
- 534 Tennessee Cir
- 0 Burns Ln
- 516 Keck St
- 521 Devon St
- 727 Ic King Rd
- 372 Overlook Dr
- 1137 Oakes Vista Ln
- 5925 Sevierville Rd
- 401 Burns Ln
- 139 Creekwood Way
- 204 Joy St
- 1 Chapman Hwy
- 716 Whippoorwill Cir
- 720 Whippoorwill Cir
- 629 Crestview Ct
- 651 Crestview Ct
- 619 Crestview Ct
- 710 Quails Nest Ct
- 724 Whippoorwill Cir
- 642 Crestview Ct
- 737 Hinkle Estates Dr
- 714 Quails Nest Ct
- 706 Whippoorwill Cir
- 707 Whippoorwill Cir
- 783 Whippoorwill Cir
- 655 Crestview Ct
- 741 Hinkle Estates Dr
- 646 Crestview Ct
- 705 Whippoorwill Cir
- 723 Whippoorwill Cir
- 745 Hinkle Estates Dr
- 619 Quails Nest Ct