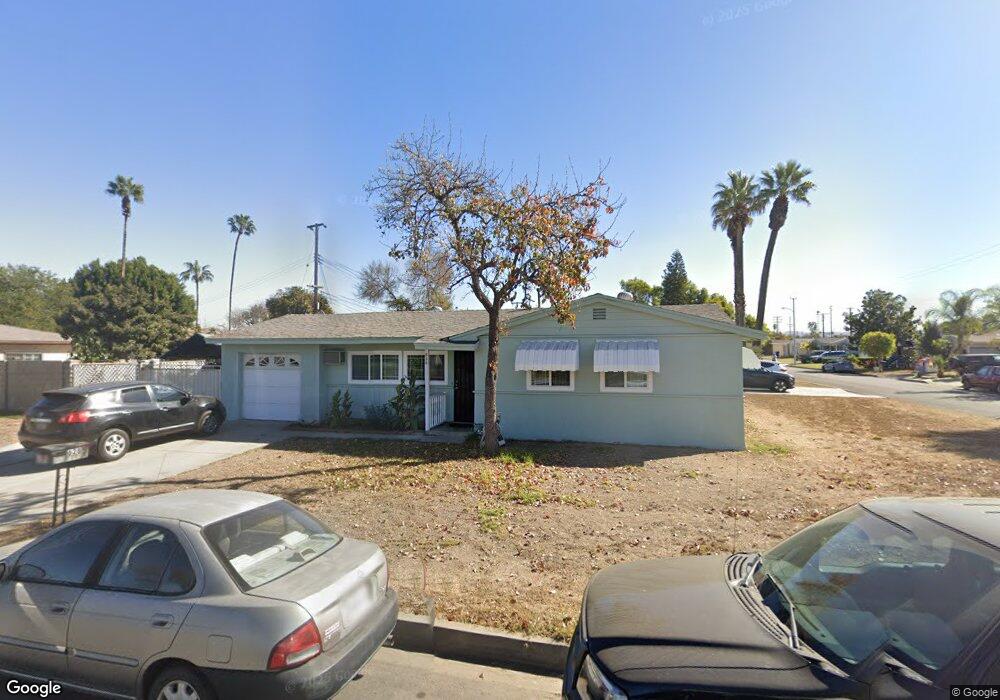
628 Perth Ave La Puente, CA 91744
Estimated Value: $678,000 - $725,000
3
Beds
1
Bath
886
Sq Ft
$789/Sq Ft
Est. Value
About This Home
This home is located at 628 Perth Ave, La Puente, CA 91744 and is currently estimated at $698,933, approximately $788 per square foot. 628 Perth Ave is a home located in Los Angeles County with nearby schools including Sparks Elementary School, Sierra Vista Middle School, and La Puente High School.
Ownership History
Date
Name
Owned For
Owner Type
Purchase Details
Closed on
Aug 4, 2025
Sold by
Rivera Jose Napoleon and Rivera Mirna E
Bought by
Jose Napoleon And Mirna Elizabeth Rivera Join and Rivera
Current Estimated Value
Purchase Details
Closed on
Oct 13, 2004
Sold by
Loya Ruben and Loya Saralee
Bought by
Rivera Jose Napoleon
Home Financials for this Owner
Home Financials are based on the most recent Mortgage that was taken out on this home.
Original Mortgage
$249,600
Interest Rate
6.75%
Mortgage Type
Purchase Money Mortgage
Purchase Details
Closed on
Sep 21, 1999
Sold by
The Stark Family Trust and James R
Bought by
Loya Ruben
Home Financials for this Owner
Home Financials are based on the most recent Mortgage that was taken out on this home.
Original Mortgage
$136,401
Interest Rate
7.82%
Mortgage Type
FHA
Create a Home Valuation Report for This Property
The Home Valuation Report is an in-depth analysis detailing your home's value as well as a comparison with similar homes in the area
Home Values in the Area
Average Home Value in this Area
Purchase History
| Date | Buyer | Sale Price | Title Company |
|---|---|---|---|
| Jose Napoleon And Mirna Elizabeth Rivera Join | -- | None Listed On Document | |
| Rivera Jose Napoleon | $312,000 | United Title Company | |
| Loya Ruben | $137,500 | Southland Title |
Source: Public Records
Mortgage History
| Date | Status | Borrower | Loan Amount |
|---|---|---|---|
| Previous Owner | Rivera Jose Napoleon | $249,600 | |
| Previous Owner | Loya Ruben | $136,401 | |
| Closed | Rivera Jose Napoleon | $62,400 |
Source: Public Records
Tax History
| Year | Tax Paid | Tax Assessment Tax Assessment Total Assessment is a certain percentage of the fair market value that is determined by local assessors to be the total taxable value of land and additions on the property. | Land | Improvement |
|---|---|---|---|---|
| 2025 | $5,394 | $434,876 | $347,909 | $86,967 |
| 2024 | $5,394 | $426,350 | $341,088 | $85,262 |
| 2023 | $5,256 | $417,991 | $334,400 | $83,591 |
| 2022 | $5,103 | $409,796 | $327,844 | $81,952 |
| 2021 | $5,013 | $401,762 | $321,416 | $80,346 |
| 2019 | $4,868 | $389,848 | $311,884 | $77,964 |
| 2018 | $4,723 | $382,205 | $305,769 | $76,436 |
| 2016 | $3,930 | $326,000 | $261,000 | $65,000 |
| 2015 | $3,911 | $326,000 | $261,000 | $65,000 |
| 2014 | $3,733 | $309,000 | $247,000 | $62,000 |
Source: Public Records
Map
Nearby Homes
- 611 Santo Oro Ave
- 15865 Sierra Vista Ct
- 826 Del Valle Ave
- 1023 Gilwood Ave
- 15426 Hayland St
- 209 N Stimson Ave
- 16060 Las Vecinas Dr
- 1133 Aldgate Ave
- 1084 Del Valle Ave
- 14641 Lassalette St
- 1069 Aileron Ave
- 14612 Hutchcroft St
- 15865 Cadwell St
- 226 Shay Ave
- 16203 Bluebonnet St
- 15925 Amar Rd
- 15937 Amar Rd
- 15943 Amar Rd
- 16149 Abbey St
- 15947 Amar Rd
- 15411 Lassalette St
- 642 Perth Ave
- 15408 Hutchcroft St
- 15417 Lassalette St
- 635 Perth Ave
- 618 Perth Ave
- 627 Perth Ave
- 15408 Lassalette St
- 15416 Hutchcroft St
- 641 Perth Ave
- 621 Perth Ave
- 15416 Lassalette St
- 15423 Lassalette St
- 647 Perth Ave
- 15422 Hutchcroft St
- 702 Perth Ave
- 15422 Lassalette St
- 632 Ivanell Ave
- 15411 Hutchcroft St
- 626 Ivanell Ave
Your Personal Tour Guide
Ask me questions while you tour the home.