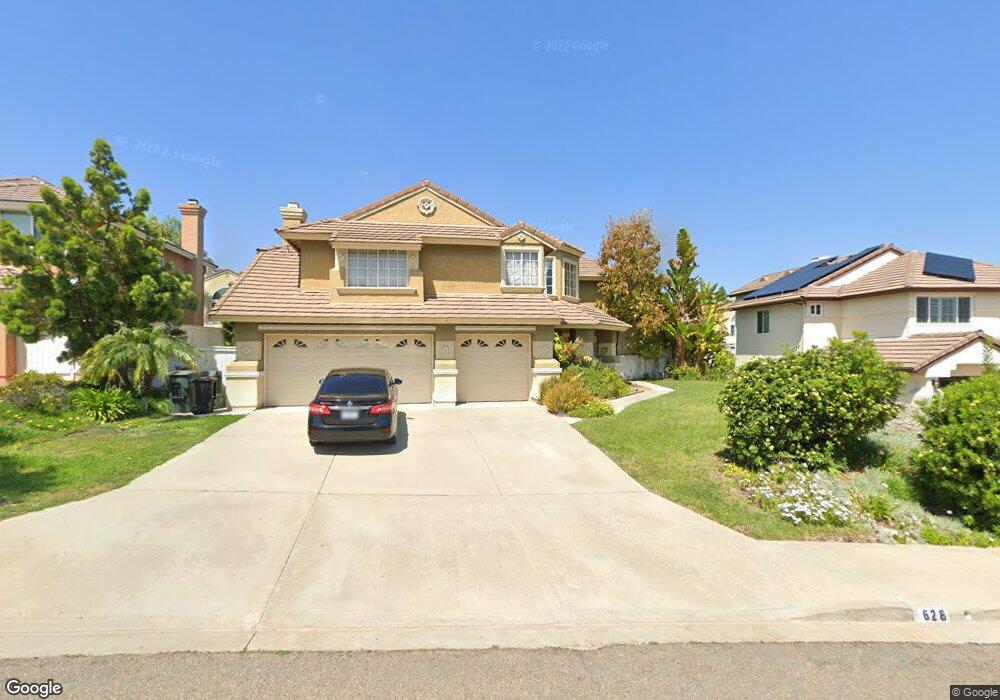
628 Port Trinity Chula Vista, CA 91913
Eastlake NeighborhoodEstimated Value: $908,000 - $1,097,000
4
Beds
3
Baths
2,407
Sq Ft
$420/Sq Ft
Est. Value
About This Home
This home is located at 628 Port Trinity, Chula Vista, CA 91913 and is currently estimated at $1,011,807, approximately $420 per square foot. 628 Port Trinity is a home located in San Diego County with nearby schools including Eastlake Elementary School, Bonita Vista Middle School, and Bonita Vista Senior High School.
Ownership History
Date
Name
Owned For
Owner Type
Purchase Details
Closed on
Mar 4, 2010
Sold by
Avila Felipe and Avila Andrea
Bought by
Adams Peter
Current Estimated Value
Home Financials for this Owner
Home Financials are based on the most recent Mortgage that was taken out on this home.
Original Mortgage
$201,500
Outstanding Balance
$133,283
Interest Rate
4.94%
Mortgage Type
New Conventional
Estimated Equity
$878,524
Purchase Details
Closed on
Dec 14, 2004
Sold by
Avila Felipe and Avila Andrea
Bought by
Avila Felipe and Avila Andrea
Home Financials for this Owner
Home Financials are based on the most recent Mortgage that was taken out on this home.
Original Mortgage
$400,000
Interest Rate
5.5%
Mortgage Type
Stand Alone Refi Refinance Of Original Loan
Purchase Details
Closed on
Jul 29, 2004
Sold by
Avila Felipe and Avila Andrea
Bought by
Avila Felipe and Avila Andrea
Purchase Details
Closed on
Nov 6, 1987
Create a Home Valuation Report for This Property
The Home Valuation Report is an in-depth analysis detailing your home's value as well as a comparison with similar homes in the area
Home Values in the Area
Average Home Value in this Area
Purchase History
| Date | Buyer | Sale Price | Title Company |
|---|---|---|---|
| Adams Peter | $352,000 | California Title Company | |
| Avila Felipe | -- | First American Title Co | |
| Avila Felipe | -- | -- | |
| Avila Felipe | -- | -- | |
| -- | $173,900 | -- |
Source: Public Records
Mortgage History
| Date | Status | Borrower | Loan Amount |
|---|---|---|---|
| Open | Adams Peter | $201,500 | |
| Previous Owner | Avila Felipe | $400,000 |
Source: Public Records
Tax History
| Year | Tax Paid | Tax Assessment Tax Assessment Total Assessment is a certain percentage of the fair market value that is determined by local assessors to be the total taxable value of land and additions on the property. | Land | Improvement |
|---|---|---|---|---|
| 2025 | $3,231 | $453,706 | $84,633 | $369,073 |
| 2024 | $3,231 | $444,811 | $82,974 | $361,837 |
| 2023 | $3,240 | $436,091 | $81,348 | $354,743 |
| 2022 | $3,238 | $427,541 | $79,753 | $347,788 |
| 2021 | $3,153 | $419,159 | $78,190 | $340,969 |
| 2020 | $4,639 | $414,862 | $77,389 | $337,473 |
| 2019 | $4,514 | $406,728 | $75,872 | $330,856 |
| 2018 | $4,439 | $398,754 | $74,385 | $324,369 |
| 2017 | $11 | $390,936 | $72,927 | $318,009 |
| 2016 | $4,235 | $383,272 | $71,498 | $311,774 |
| 2015 | $4,172 | $377,516 | $70,425 | $307,091 |
| 2014 | $4,096 | $370,122 | $69,046 | $301,076 |
Source: Public Records
Map
Nearby Homes
- 2011 Lakeridge Cir Unit 304
- 2035 Lakeridge Cir Unit 203
- 749 Brookstone Rd Unit 101
- 1929 Duke St
- 773 Brookstone Rd Unit 304
- 2063 Lakeridge Cir Unit 101
- 2083 Lakeridge Cir Unit 104
- 2148 New Haven Dr
- 2128 Northshore Dr Unit B
- 760 Eastshore Terrace Unit 139
- 744 Eastshore Terrace Unit 102
- 732 Eastshore Terrace Unit 77
- 774 Eastshore Terrace Unit 169
- 2140 Waterside Dr
- 765 Eastshore Terrace Unit 201
- 753 Eastshore Terrace Unit 127
- 4334 Corral Canyon Rd
- 1753 Ithaca St
- 1925 Otay Lakes Rd Unit 148
- 1925 Otay Lakes Rd Unit 43
- 632 Port Trinity
- 624 Port Trinity
- 599 Port Harwick
- 591 Port Harwick
- 620 Port Trinity
- 587 Port Harwick
- 633 Port Trinity
- 621 Port Trinity
- 1862 Port Albans
- 1866 Port Albans
- 1858 Port Albans
- 1870 Port Albans
- 590 Port Harwick
- 594 Port Harwick
- 1874 Port Albans
- 586 Port Harwick
- 1854 Port Albans Unit 18
- 579 Port Harwick
- 598 Port Harwick
Your Personal Tour Guide
Ask me questions while you tour the home.