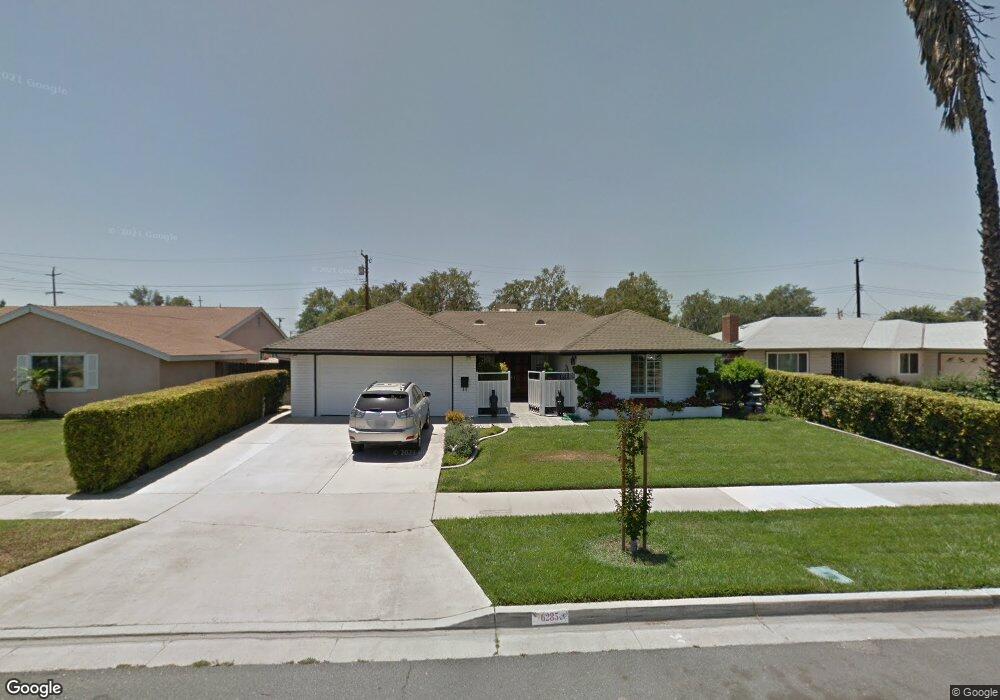
6285 Arch Way Riverside, CA 92506
Magnolia Center NeighborhoodEstimated Value: $580,000 - $645,000
3
Beds
2
Baths
1,441
Sq Ft
$424/Sq Ft
Est. Value
About This Home
This home is located at 6285 Arch Way, Riverside, CA 92506 and is currently estimated at $611,445, approximately $424 per square foot. 6285 Arch Way is a home located in Riverside County with nearby schools including Magnolia Elementary School, Sierra Middle School, and Ramona High School.
Ownership History
Date
Name
Owned For
Owner Type
Purchase Details
Closed on
Feb 29, 2024
Sold by
Sumerford Dawn A
Bought by
Dawn A Sumerford Living Trust and Sumerford
Current Estimated Value
Purchase Details
Closed on
Sep 16, 2023
Sold by
Gonda Glen P and Gonda Ann
Bought by
Sumerford Dawn A and Sumerford Chris Hugh
Purchase Details
Closed on
Jul 19, 2011
Sold by
Blanton Gonda Ann
Bought by
Blanton Gonda Ann and Glen P Blanton & Gonda Ann Blanton 2005
Home Financials for this Owner
Home Financials are based on the most recent Mortgage that was taken out on this home.
Original Mortgage
$100,000
Interest Rate
4.53%
Mortgage Type
Credit Line Revolving
Purchase Details
Closed on
Jan 4, 2005
Sold by
Blanton Glen P and Sumerford Blanton Gonda Ann
Bought by
Blantion Glen P and Blanton Gonda Ann
Create a Home Valuation Report for This Property
The Home Valuation Report is an in-depth analysis detailing your home's value as well as a comparison with similar homes in the area
Home Values in the Area
Average Home Value in this Area
Purchase History
| Date | Buyer | Sale Price | Title Company |
|---|---|---|---|
| Dawn A Sumerford Living Trust | -- | None Listed On Document | |
| Sumerford Dawn A | -- | None Listed On Document | |
| Blanton Gonda Ann | -- | None Available | |
| Blantion Glen P | -- | -- |
Source: Public Records
Mortgage History
| Date | Status | Borrower | Loan Amount |
|---|---|---|---|
| Previous Owner | Blanton Gonda Ann | $100,000 |
Source: Public Records
Tax History
| Year | Tax Paid | Tax Assessment Tax Assessment Total Assessment is a certain percentage of the fair market value that is determined by local assessors to be the total taxable value of land and additions on the property. | Land | Improvement |
|---|---|---|---|---|
| 2025 | $5,982 | $551,412 | $166,464 | $384,948 |
| 2023 | $5,982 | $167,907 | $56,278 | $111,629 |
| 2022 | $1,819 | $164,616 | $55,175 | $109,441 |
| 2021 | $1,807 | $161,390 | $54,094 | $107,296 |
| 2020 | $1,792 | $159,736 | $53,540 | $106,196 |
| 2019 | $1,758 | $156,605 | $52,491 | $104,114 |
| 2018 | $1,723 | $153,535 | $51,462 | $102,073 |
| 2017 | $1,692 | $150,525 | $50,453 | $100,072 |
| 2016 | $1,585 | $147,574 | $49,464 | $98,110 |
| 2015 | $1,561 | $145,360 | $48,722 | $96,638 |
| 2014 | $1,544 | $142,514 | $47,768 | $94,746 |
Source: Public Records
Map
Nearby Homes
- 6240 Wiehe Ave
- 6176 Wiehe Ave
- 4660 Cover St
- 4593 Merrill Ave
- 4538 Merrill Ave
- 4693 Central Ave
- 4815 Jurupa Ave
- 4831 Jurupa Ave
- 4939 Plumtree Ct
- 4866 Sunnyside Dr
- 4427 Sunnyside Dr
- 5033 Brooklawn Place
- 5050 Brooklawn Place
- 6095 Correll St
- 4329 Central Ave
- 5035 Carlingford Ave
- 6736 Nicolett St
- 5847 Meadowbrook Ln
- 5171 Merrill Ave
- 5943 Grand Ave
- 6275 Arch Way
- 6280 Raleigh St
- 6270 Raleigh St
- 6290 Raleigh St
- 6265 Arch Way
- 6299 Arch Way
- 4696 Gardena Dr
- 6260 Raleigh St
- 6235 Arch Way
- 4730 Gardena Dr
- 4686 Gardena Dr
- 6250 Raleigh St
- 4695 Gardena Dr
- 4740 Gardena Dr
- 6223 Arch Way
- 6275 Raleigh St
- 4676 Gardena Dr
- 4685 Gardena Dr
- 6240 Raleigh St
- 6265 Raleigh St
Your Personal Tour Guide
Ask me questions while you tour the home.