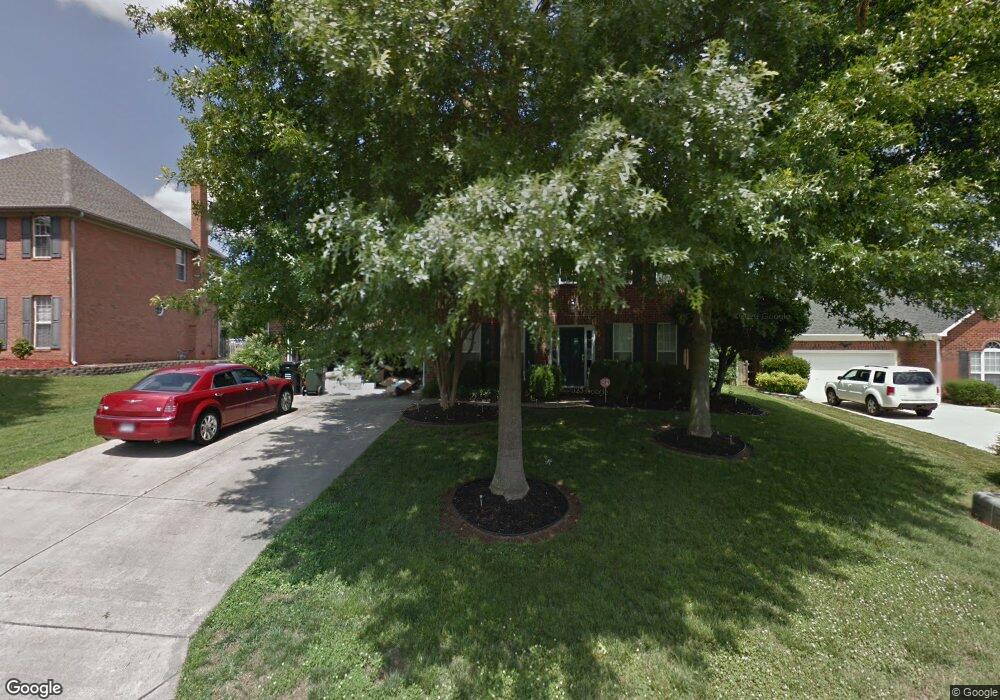
629 Gable Oaks Ln NW Unit 7 Concord, NC 28027
Estimated Value: $412,000 - $447,000
4
Beds
3
Baths
1,916
Sq Ft
$224/Sq Ft
Est. Value
About This Home
This home is located at 629 Gable Oaks Ln NW Unit 7, Concord, NC 28027 and is currently estimated at $429,513, approximately $224 per square foot. 629 Gable Oaks Ln NW Unit 7 is a home located in Cabarrus County with nearby schools including Carl A. Furr Elementary School, Harold E. Winkler Middle School, and Cabarrus Charter Academy.
Ownership History
Date
Name
Owned For
Owner Type
Purchase Details
Closed on
Jul 18, 2023
Sold by
Progress Residential Exchange Borrower L
Bought by
Invitation Homes 7 Lp
Current Estimated Value
Purchase Details
Closed on
Apr 14, 2021
Sold by
Progress Residential Borrower 1 Llc
Bought by
Progress Res Exchange Borrower Llc
Purchase Details
Closed on
Sep 16, 2016
Sold by
Lowder Robyn E and Lowder Susan A
Bought by
Freo North Carolina Llc
Purchase Details
Closed on
Feb 21, 2007
Sold by
Lambert Russell G and Lambert Angela W
Bought by
Lowder Robyn E and Lowder Susan A
Home Financials for this Owner
Home Financials are based on the most recent Mortgage that was taken out on this home.
Original Mortgage
$165,600
Interest Rate
6.17%
Mortgage Type
Purchase Money Mortgage
Purchase Details
Closed on
May 1, 1996
Bought by
Lambert Russell G and Lambert Wife
Create a Home Valuation Report for This Property
The Home Valuation Report is an in-depth analysis detailing your home's value as well as a comparison with similar homes in the area
Home Values in the Area
Average Home Value in this Area
Purchase History
| Date | Buyer | Sale Price | Title Company |
|---|---|---|---|
| Invitation Homes 7 Lp | $1,051,500 | None Listed On Document | |
| Progress Res Exchange Borrower Llc | -- | Accommodation | |
| Freo North Carolina Llc | $207,000 | None Available | |
| Lowder Robyn E | $207,000 | Statewide Title Inc | |
| Lambert Russell G | $146,500 | -- |
Source: Public Records
Mortgage History
| Date | Status | Borrower | Loan Amount |
|---|---|---|---|
| Previous Owner | Lowder Robyn E | $165,600 |
Source: Public Records
Tax History Compared to Growth
Tax History
| Year | Tax Paid | Tax Assessment Tax Assessment Total Assessment is a certain percentage of the fair market value that is determined by local assessors to be the total taxable value of land and additions on the property. | Land | Improvement |
|---|---|---|---|---|
| 2025 | $3,631 | $364,530 | $90,000 | $274,530 |
| 2024 | $3,631 | $364,530 | $90,000 | $274,530 |
| 2023 | $2,699 | $221,230 | $55,000 | $166,230 |
| 2022 | $2,687 | $220,240 | $55,000 | $165,240 |
| 2021 | $2,687 | $220,240 | $55,000 | $165,240 |
| 2020 | $2,687 | $220,240 | $55,000 | $165,240 |
| 2019 | $2,323 | $190,370 | $40,000 | $150,370 |
| 2018 | $2,284 | $190,370 | $40,000 | $150,370 |
| 2017 | $2,246 | $190,370 | $40,000 | $150,370 |
| 2016 | $1,333 | $161,850 | $35,000 | $126,850 |
| 2015 | $1,910 | $161,850 | $35,000 | $126,850 |
| 2014 | $1,910 | $161,850 | $35,000 | $126,850 |
Source: Public Records
Map
Nearby Homes
- 6525 Derby Ln NW
- 597 Gatsby Place NW
- 1337 Braeburn Rd NW
- 888 Craigmont Ln NW
- 6119 Village Dr NW
- 1231 Bennington Dr NW
- 5618 Burck Dr NW
- 5505 Yorke St NW
- 1507 Chadmore Ln NW
- 75 Mccurdy St NW Unit 75
- 439 Beacon St NW
- 447 Beacon St NW
- 5554 Village Dr NW
- 5461 Ives St NW
- 5619 Weddington Rd
- 5807 Monticello Dr NW
- 1735 Park Grove Place NW
- 4940 Weddington Rd NW
- 5811 Monticello Dr NW
- 5711 Monticello Dr NW
- 629 Gable Oaks Ln NW
- 625 Gable Oaks Ln NW
- 631 Gable Oaks Ln NW
- 6510 Derby Ln NW
- 635 Gable Oaks Ln NW
- 558 Gatsby Place NW
- 623 Gable Oaks Ln NW
- 562 Gatsby Place NW
- 632 Gable Oaks Ln NW
- 6502 Derby Ln NW
- 637 Gable Oaks Ln NW
- 566 Gatsby Place NW
- 628 Gable Oaks Ln NW
- 636 Gable Oaks Ln NW
- 636 Gable Oaks Ln NW Unit 31
- 570 Gatsby Place NW
- 624 Gable Oaks Ln NW
- 6586 Gatehouse Ct NW
- 6513 Derby Ln NW
- 639 Gable Oaks Ln NW