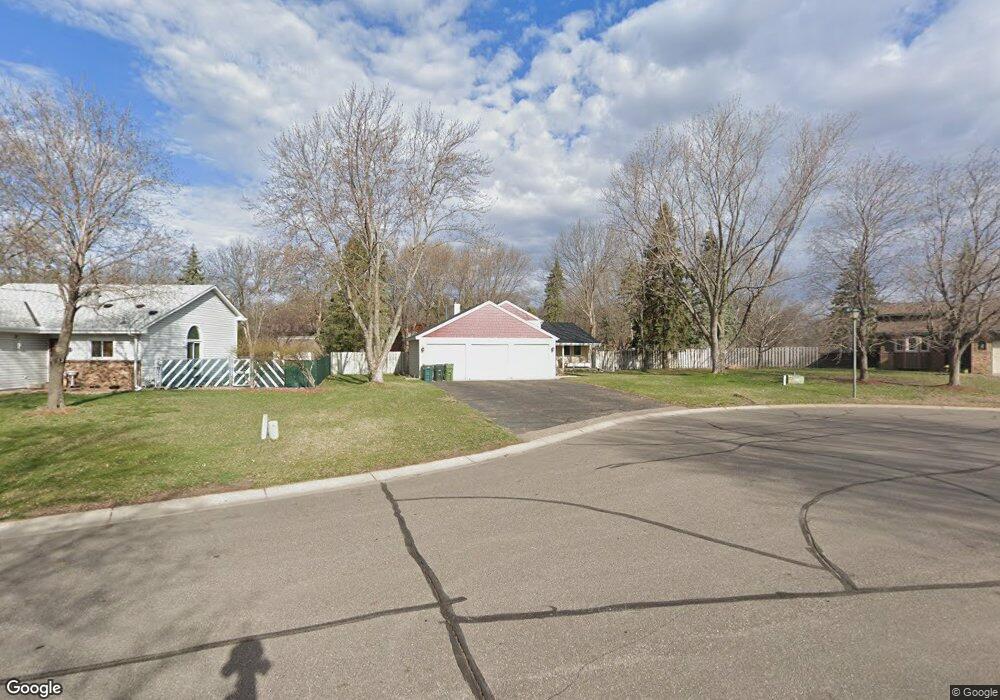
63 108th Ave NW Coon Rapids, MN 55448
Estimated Value: $358,500 - $403,000
4
Beds
3
Baths
2,456
Sq Ft
$154/Sq Ft
Est. Value
About This Home
This home is located at 63 108th Ave NW, Coon Rapids, MN 55448 and is currently estimated at $377,375, approximately $153 per square foot. 63 108th Ave NW is a home located in Anoka County with nearby schools including Eisenhower Elementary School, Laughlin Junior/Senior High School, and Coon Rapids Middle School.
Ownership History
Date
Name
Owned For
Owner Type
Purchase Details
Closed on
Jul 30, 2021
Sold by
Wiehle Jessica A and Ruhland Jessica Ann
Bought by
Ruhland Michael
Current Estimated Value
Home Financials for this Owner
Home Financials are based on the most recent Mortgage that was taken out on this home.
Original Mortgage
$162,000
Outstanding Balance
$136,083
Interest Rate
2.9%
Mortgage Type
New Conventional
Estimated Equity
$241,292
Purchase Details
Closed on
Jul 14, 2008
Sold by
Shutes Billy J and Epperson Janice
Bought by
Niehle Jessica A
Home Financials for this Owner
Home Financials are based on the most recent Mortgage that was taken out on this home.
Original Mortgage
$172,296
Interest Rate
6.36%
Mortgage Type
FHA
Purchase Details
Closed on
Oct 18, 2001
Sold by
Rhee Eun K and Rhee Steve C
Bought by
Kim Hoe Jun and Kim Soon Jae
Purchase Details
Closed on
Apr 15, 1999
Sold by
Prazak Todd R and Prazak Doreen K
Bought by
Rhee Steven C
Create a Home Valuation Report for This Property
The Home Valuation Report is an in-depth analysis detailing your home's value as well as a comparison with similar homes in the area
Home Values in the Area
Average Home Value in this Area
Purchase History
| Date | Buyer | Sale Price | Title Company |
|---|---|---|---|
| Ruhland Michael | -- | Legacy Title | |
| Niehle Jessica A | $175,000 | -- | |
| Kim Hoe Jun | $174,900 | -- | |
| Rhee Steven C | $122,000 | -- |
Source: Public Records
Mortgage History
| Date | Status | Borrower | Loan Amount |
|---|---|---|---|
| Open | Ruhland Michael | $162,000 | |
| Closed | Niehle Jessica A | $172,296 |
Source: Public Records
Tax History Compared to Growth
Tax History
| Year | Tax Paid | Tax Assessment Tax Assessment Total Assessment is a certain percentage of the fair market value that is determined by local assessors to be the total taxable value of land and additions on the property. | Land | Improvement |
|---|---|---|---|---|
| 2025 | $4,066 | $359,700 | $79,800 | $279,900 |
| 2024 | $4,066 | $364,600 | $89,800 | $274,800 |
| 2023 | $3,815 | $355,500 | $74,900 | $280,600 |
| 2022 | $3,416 | $364,600 | $69,800 | $294,800 |
| 2021 | $3,376 | $291,300 | $60,900 | $230,400 |
| 2020 | $3,529 | $281,400 | $61,800 | $219,600 |
| 2019 | $3,358 | $282,200 | $66,200 | $216,000 |
| 2018 | $2,980 | $261,300 | $0 | $0 |
| 2017 | $2,637 | $242,600 | $0 | $0 |
| 2016 | $2,744 | $217,000 | $0 | $0 |
| 2015 | -- | $217,000 | $55,400 | $161,600 |
| 2014 | -- | $186,100 | $49,900 | $136,200 |
Source: Public Records
Map
Nearby Homes
- 251 109th Ln NW
- 341 109th Ave NW
- 11044 5th St NE
- 122 106th Ave NW
- 22 111th Ln NE Unit 26
- 11167 3rd St NE Unit 102
- 10931 7th St NE
- 11164 4th St NE Unit 88
- 11200 3rd St NE Unit 13
- 11156 5th St NE Unit 60
- 11163 4th St NE Unit 71
- 110 111th Square NE Unit 140
- 11204 5th St NE Unit 55
- 11205 5th St NE Unit 43
- 11220 4th St NE Unit 81
- 11217 4th St NE Unit 77
- 114 112th Square NE Unit 156
- 127 111th Square NE Unit 148
- 107 112th Square NE Unit 189
- 126 112th Square NE Unit 159
- 75 108th Ave NW
- 51 108th Ave NW
- 10851 Butternut St NW
- 10825 Butternut St NW
- 40 108th Ave NW
- 10891 Butternut St NW
- 46 108th Ave NW
- 64 108th Ave NW
- 52 108th Ave NW
- 70 108th Ave NW
- 76 108th Ave NW
- 58 108th Ave NW
- 10913 Butternut St NW
- 82 108th Ave NW
- 88 108th Ave NW
- 94 108th Ave NW
- 10925 Butternut St NW
- 10844 Butternut St NW
- 10828 Butternut St NW
- 10812 Butternut St NW