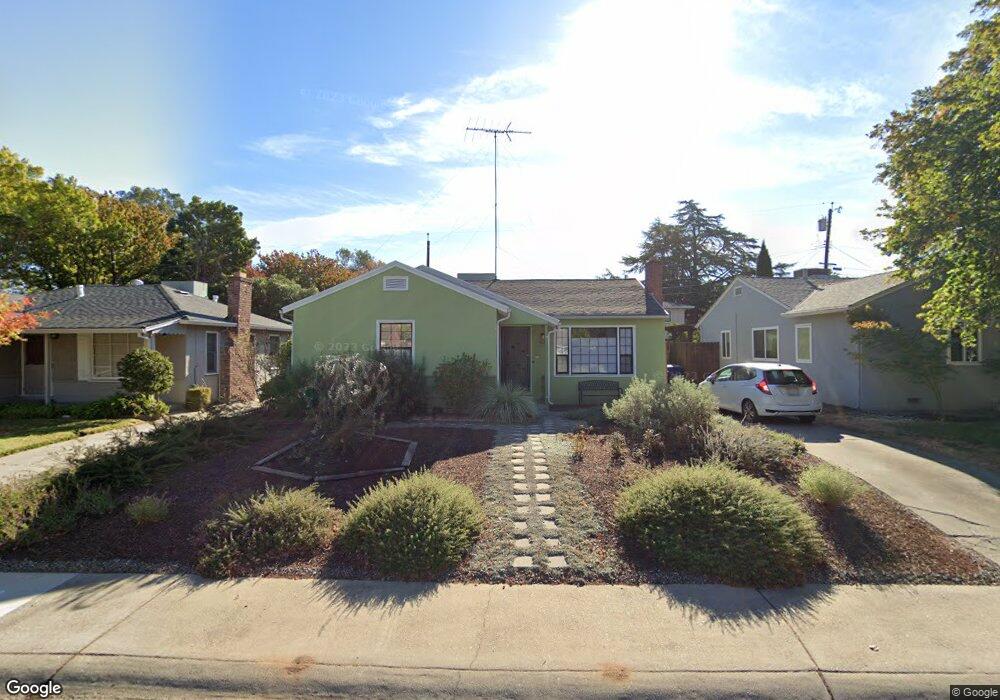
63 50th St Sacramento, CA 95819
East Sacramento NeighborhoodEstimated Value: $595,564 - $632,000
3
Beds
1
Bath
1,050
Sq Ft
$578/Sq Ft
Est. Value
About This Home
This home is located at 63 50th St, Sacramento, CA 95819 and is currently estimated at $606,391, approximately $577 per square foot. 63 50th St is a home located in Sacramento County with nearby schools including Theodore Judah Elementary, Miwok Middle School, and Hiram W. Johnson High School.
Ownership History
Date
Name
Owned For
Owner Type
Purchase Details
Closed on
Dec 20, 2006
Sold by
Pease Arthur H and Branch Revocable Living Trust
Bought by
Sampson Ellen E
Current Estimated Value
Home Financials for this Owner
Home Financials are based on the most recent Mortgage that was taken out on this home.
Original Mortgage
$90,000
Outstanding Balance
$53,869
Interest Rate
6.33%
Mortgage Type
Purchase Money Mortgage
Estimated Equity
$552,522
Purchase Details
Closed on
Mar 8, 2005
Sold by
Branch June M
Bought by
Branch June M and Branch Revocable Living Trust
Create a Home Valuation Report for This Property
The Home Valuation Report is an in-depth analysis detailing your home's value as well as a comparison with similar homes in the area
Home Values in the Area
Average Home Value in this Area
Purchase History
| Date | Buyer | Sale Price | Title Company |
|---|---|---|---|
| Sampson Ellen E | $362,000 | Fidelity National Title Co | |
| Branch June M | -- | -- |
Source: Public Records
Mortgage History
| Date | Status | Borrower | Loan Amount |
|---|---|---|---|
| Open | Sampson Ellen E | $90,000 |
Source: Public Records
Tax History Compared to Growth
Tax History
| Year | Tax Paid | Tax Assessment Tax Assessment Total Assessment is a certain percentage of the fair market value that is determined by local assessors to be the total taxable value of land and additions on the property. | Land | Improvement |
|---|---|---|---|---|
| 2025 | $1,261 | $95,570 | $21,320 | $74,250 |
| 2024 | $1,261 | $93,697 | $20,902 | $72,795 |
| 2023 | $1,230 | $91,861 | $20,493 | $71,368 |
| 2022 | $1,207 | $90,061 | $20,092 | $69,969 |
| 2021 | $1,154 | $88,297 | $19,699 | $68,598 |
| 2020 | $1,157 | $87,393 | $19,498 | $67,895 |
| 2019 | $1,132 | $85,680 | $19,116 | $66,564 |
| 2018 | $1,102 | $84,001 | $18,742 | $65,259 |
| 2017 | $1,085 | $82,355 | $18,375 | $63,980 |
| 2016 | $1,040 | $80,741 | $18,015 | $62,726 |
| 2015 | $1,024 | $79,529 | $17,745 | $61,784 |
| 2014 | $999 | $77,972 | $17,398 | $60,574 |
Source: Public Records
Map
Nearby Homes