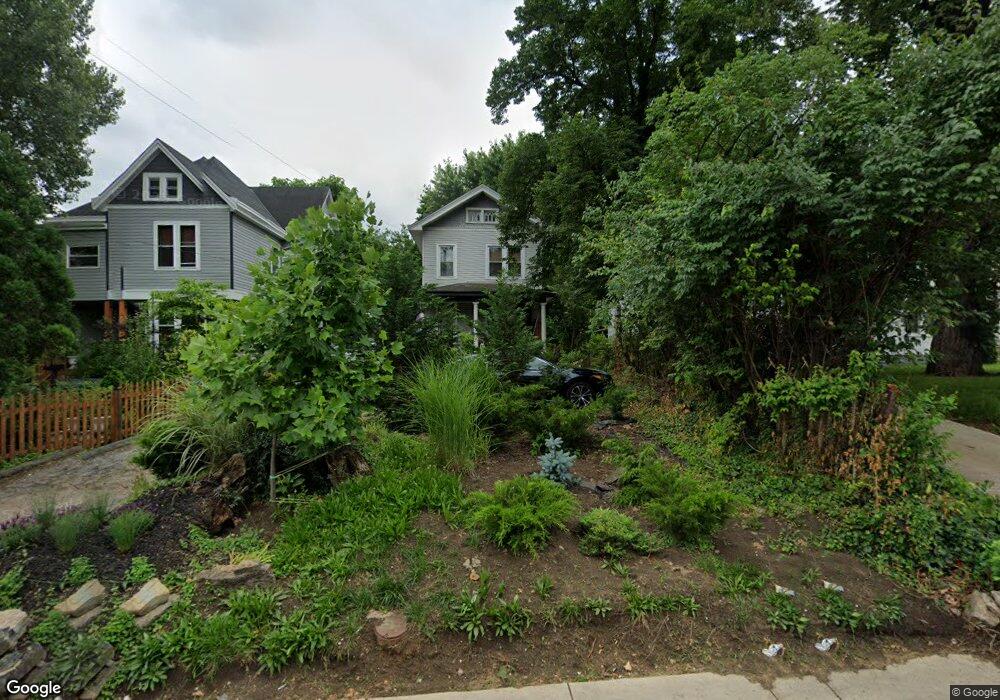
63 E Galbraith Rd Cincinnati, OH 45216
Hartwell NeighborhoodEstimated Value: $200,000 - $270,000
4
Beds
2
Baths
1,813
Sq Ft
$123/Sq Ft
Est. Value
About This Home
This home is located at 63 E Galbraith Rd, Cincinnati, OH 45216 and is currently estimated at $223,253, approximately $123 per square foot. 63 E Galbraith Rd is a home located in Hamilton County with nearby schools including Rising Stars at Carthage, Hartwell School, and Shroder High School.
Ownership History
Date
Name
Owned For
Owner Type
Purchase Details
Closed on
Sep 25, 2008
Sold by
Waits Christopher R and Waits Elizabeth
Bought by
Cummins Shelly L
Current Estimated Value
Home Financials for this Owner
Home Financials are based on the most recent Mortgage that was taken out on this home.
Original Mortgage
$99,931
Outstanding Balance
$65,648
Interest Rate
6.52%
Mortgage Type
FHA
Estimated Equity
$157,605
Purchase Details
Closed on
Apr 24, 2008
Sold by
Fannie Mae
Bought by
Waits Christopher R
Purchase Details
Closed on
Jan 15, 2008
Sold by
Kelley Colleen M
Bought by
Federal National Mortgage Association
Purchase Details
Closed on
Nov 21, 2003
Sold by
Weigand Wilfrid J and Weigand Linda M
Bought by
Kelley Collen M
Home Financials for this Owner
Home Financials are based on the most recent Mortgage that was taken out on this home.
Original Mortgage
$116,392
Interest Rate
6.1%
Mortgage Type
FHA
Create a Home Valuation Report for This Property
The Home Valuation Report is an in-depth analysis detailing your home's value as well as a comparison with similar homes in the area
Home Values in the Area
Average Home Value in this Area
Purchase History
| Date | Buyer | Sale Price | Title Company |
|---|---|---|---|
| Cummins Shelly L | $101,500 | Prominent Agency Llc | |
| Waits Christopher R | -- | Lawyers Title Of Cincinnati | |
| Federal National Mortgage Association | $56,000 | None Available | |
| Kelley Collen M | -- | -- |
Source: Public Records
Mortgage History
| Date | Status | Borrower | Loan Amount |
|---|---|---|---|
| Open | Cummins Shelly L | $99,931 | |
| Previous Owner | Kelley Collen M | $116,392 | |
| Closed | Waits Christopher R | $0 |
Source: Public Records
Tax History
| Year | Tax Paid | Tax Assessment Tax Assessment Total Assessment is a certain percentage of the fair market value that is determined by local assessors to be the total taxable value of land and additions on the property. | Land | Improvement |
|---|---|---|---|---|
| 2025 | $2,961 | $47,916 | $6,990 | $40,926 |
| 2024 | $2,872 | $47,916 | $6,990 | $40,926 |
| 2023 | $2,936 | $47,916 | $6,990 | $40,926 |
| 2022 | $2,087 | $30,492 | $6,594 | $23,898 |
| 2021 | $2,006 | $30,492 | $6,594 | $23,898 |
| 2020 | $2,064 | $30,492 | $6,594 | $23,898 |
| 2019 | $2,088 | $28,231 | $6,104 | $22,127 |
| 2018 | $2,091 | $28,231 | $6,104 | $22,127 |
| 2017 | $1,987 | $28,231 | $6,104 | $22,127 |
| 2016 | $2,157 | $30,233 | $6,104 | $24,129 |
| 2015 | $1,945 | $30,233 | $6,104 | $24,129 |
| 2014 | $1,959 | $30,233 | $6,104 | $24,129 |
| 2013 | $2,098 | $31,826 | $6,426 | $25,400 |
Source: Public Records
Map
Nearby Homes
- 62 Ferndale Ave
- 19 Parkway Ave
- 29 Hartwell Ct
- 8318 Marley St
- 8421 Wiswell St
- 8338 Anthony Wayne Ave
- 8081 Woodbine Ave
- 26 W Mills Ave
- 62 Laurel St
- 8415 Mayfair St
- 7833 Dawn Rd
- 177 Burns Ave
- 324 Beech Ave
- 1501 Summit Rd
- 221 Crescent Ave
- 529 Elliott Ave
- 1808 Crest Hill Ave
- 130 Nansen St
- 645 Blanche Ave
- 332 Lux Ave
- 67 E Galbraith Rd
- 59 E Galbraith Rd
- 69 E Galbraith Rd
- 51 E Galbraith Rd
- 60 Glendale St
- 56 Glendale St
- 70 E Galbraith Rd Unit 2
- 70 E Galbraith Rd
- 8204 Burns Ave
- 74 E Galbraith Rd
- 54 Glendale St
- 75 E Galbraith Rd
- 52 Glendale St
- 45 E Galbraith Rd
- 43 E Galbraith Rd
- 54 E Galbraith Rd
- 50 Glendale St
- 8301 Burns Ave Unit 1
- 8301 Burns Ave
- 81 E Galbraith Rd
Your Personal Tour Guide
Ask me questions while you tour the home.