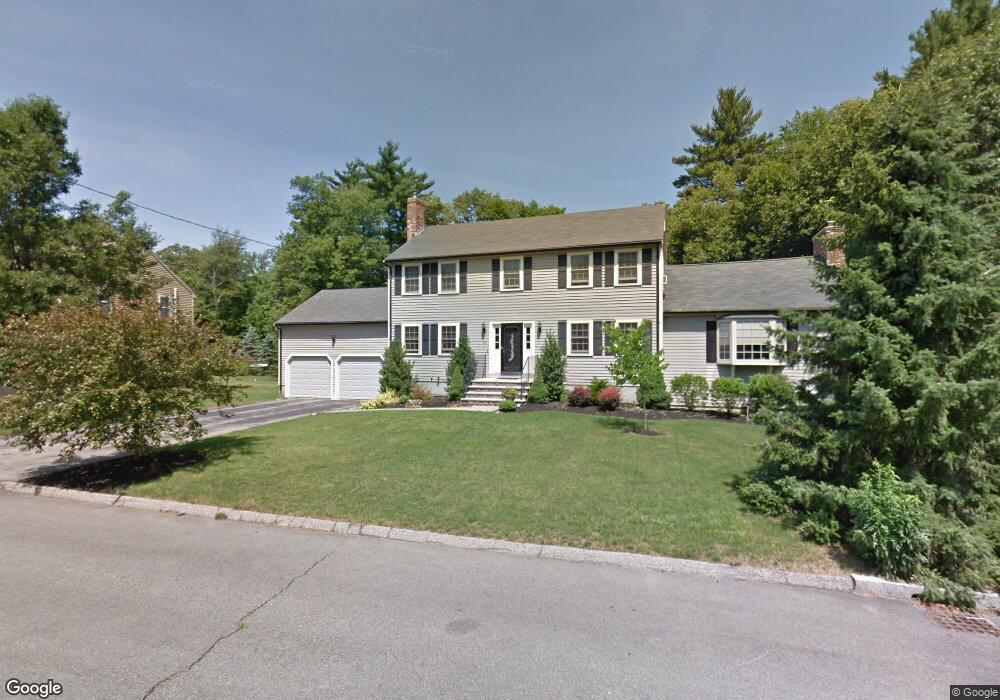
63 Ginley Rd Walpole, MA 02081
Estimated Value: $889,886 - $1,124,000
4
Beds
3
Baths
2,456
Sq Ft
$402/Sq Ft
Est. Value
About This Home
This home is located at 63 Ginley Rd, Walpole, MA 02081 and is currently estimated at $986,222, approximately $401 per square foot. 63 Ginley Rd is a home located in Norfolk County with nearby schools including Fisher School, Walpole Middle School, and Walpole High School.
Ownership History
Date
Name
Owned For
Owner Type
Purchase Details
Closed on
Sep 18, 2023
Sold by
Macomber Camille
Bought by
Camille Macomber Ft and James
Current Estimated Value
Create a Home Valuation Report for This Property
The Home Valuation Report is an in-depth analysis detailing your home's value as well as a comparison with similar homes in the area
Home Values in the Area
Average Home Value in this Area
Purchase History
| Date | Buyer | Sale Price | Title Company |
|---|---|---|---|
| Camille Macomber Ft | -- | None Available |
Source: Public Records
Tax History
| Year | Tax Paid | Tax Assessment Tax Assessment Total Assessment is a certain percentage of the fair market value that is determined by local assessors to be the total taxable value of land and additions on the property. | Land | Improvement |
|---|---|---|---|---|
| 2025 | $11,239 | $876,000 | $370,600 | $505,400 |
| 2024 | $10,872 | $822,400 | $356,300 | $466,100 |
| 2023 | $10,323 | $743,200 | $309,900 | $433,300 |
| 2022 | $9,691 | $670,200 | $287,000 | $383,200 |
| 2021 | $9,517 | $641,300 | $270,700 | $370,600 |
| 2020 | $9,123 | $608,600 | $255,400 | $353,200 |
| 2019 | $8,811 | $583,500 | $245,600 | $337,900 |
| 2018 | $8,667 | $567,600 | $236,600 | $331,000 |
| 2017 | $8,430 | $549,900 | $227,600 | $322,300 |
| 2016 | $8,202 | $527,100 | $220,000 | $307,100 |
| 2015 | $7,845 | $499,700 | $201,100 | $298,600 |
| 2014 | $7,481 | $474,700 | $201,100 | $273,600 |
Source: Public Records
Map
Nearby Homes
- 291 Plimpton St
- 7 Tilton Ct Unit Ct
- 241 Fisher St
- 56 North St
- 19 and 23 Arlington Ln
- 8 Mckinley Ave
- 26 Dover Dr
- 881 Main St Unit 9
- 2 Kendall St
- 6 Litchfields Way
- 38 Garden Pkwy
- 28 Eastover Rd Unit 28
- 260 Elm St
- 222 School St Unit 9
- 224 School St Unit 9
- 363 - 367 Washington St
- 40 Endean Dr
- 1110 Main St
- 50 Riverside Place
- 120 Polley Ln
Your Personal Tour Guide
Ask me questions while you tour the home.