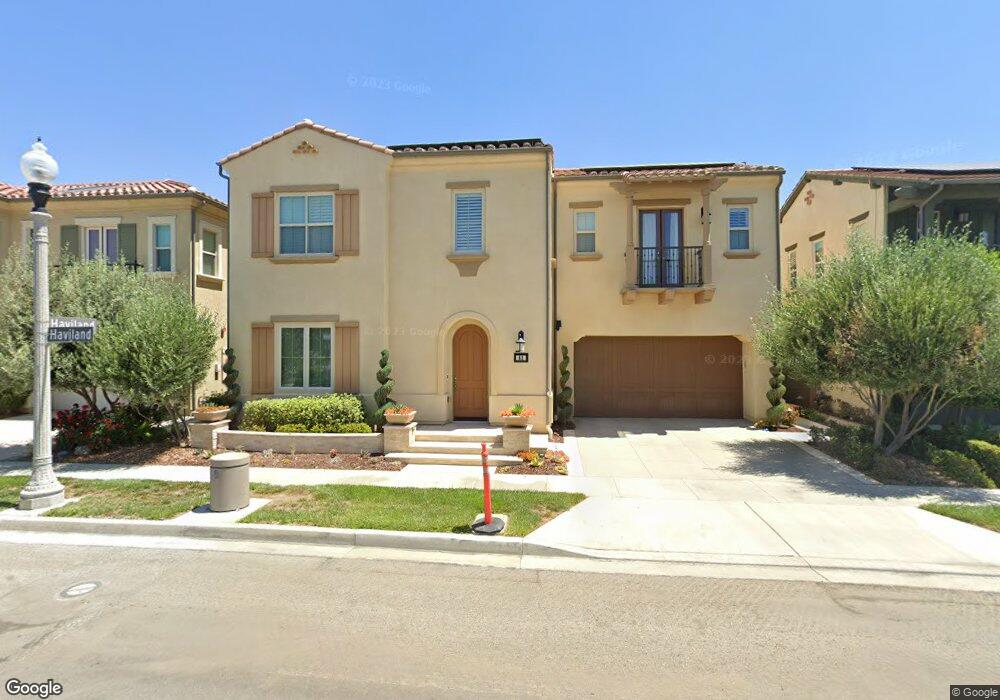
63 Haviland Irvine, CA 92620
Woodbury and Stonegate NeighborhoodEstimated Value: $2,496,432 - $2,771,000
4
Beds
4
Baths
3,086
Sq Ft
$870/Sq Ft
Est. Value
About This Home
This home is located at 63 Haviland, Irvine, CA 92620 and is currently estimated at $2,683,858, approximately $869 per square foot. 63 Haviland is a home with nearby schools including Stonegate Elementary School, Sierra Vista Middle School, and Northwood High School.
Ownership History
Date
Name
Owned For
Owner Type
Purchase Details
Closed on
Aug 11, 2015
Sold by
Richmond American Homes Of Maryland Inc
Bought by
Kwok Koon Wai and Hong Chi Yon
Current Estimated Value
Home Financials for this Owner
Home Financials are based on the most recent Mortgage that was taken out on this home.
Original Mortgage
$835,409
Interest Rate
3.81%
Mortgage Type
New Conventional
Create a Home Valuation Report for This Property
The Home Valuation Report is an in-depth analysis detailing your home's value as well as a comparison with similar homes in the area
Home Values in the Area
Average Home Value in this Area
Purchase History
| Date | Buyer | Sale Price | Title Company |
|---|---|---|---|
| Kwok Koon Wai | $1,235,500 | First American Title Company |
Source: Public Records
Mortgage History
| Date | Status | Borrower | Loan Amount |
|---|---|---|---|
| Previous Owner | Kwok Koon Wai | $835,409 |
Source: Public Records
Tax History
| Year | Tax Paid | Tax Assessment Tax Assessment Total Assessment is a certain percentage of the fair market value that is determined by local assessors to be the total taxable value of land and additions on the property. | Land | Improvement |
|---|---|---|---|---|
| 2025 | $18,641 | $1,462,469 | $800,067 | $662,402 |
| 2024 | $18,641 | $1,433,794 | $784,380 | $649,414 |
| 2023 | $18,315 | $1,405,681 | $769,000 | $636,681 |
| 2022 | $18,032 | $1,378,119 | $753,921 | $624,198 |
| 2021 | $17,748 | $1,351,098 | $739,139 | $611,959 |
| 2020 | $18,095 | $1,337,245 | $731,560 | $605,685 |
| 2019 | $18,005 | $1,311,025 | $717,216 | $593,809 |
| 2018 | $17,831 | $1,285,319 | $703,153 | $582,166 |
| 2017 | $17,564 | $1,260,117 | $689,366 | $570,751 |
| 2016 | $17,031 | $1,235,409 | $675,849 | $559,560 |
| 2015 | $4,334 | $3,591 | $3,591 | $0 |
| 2014 | $686 | $3,521 | $3,521 | $0 |
Source: Public Records
Map
Nearby Homes
Your Personal Tour Guide
Ask me questions while you tour the home.