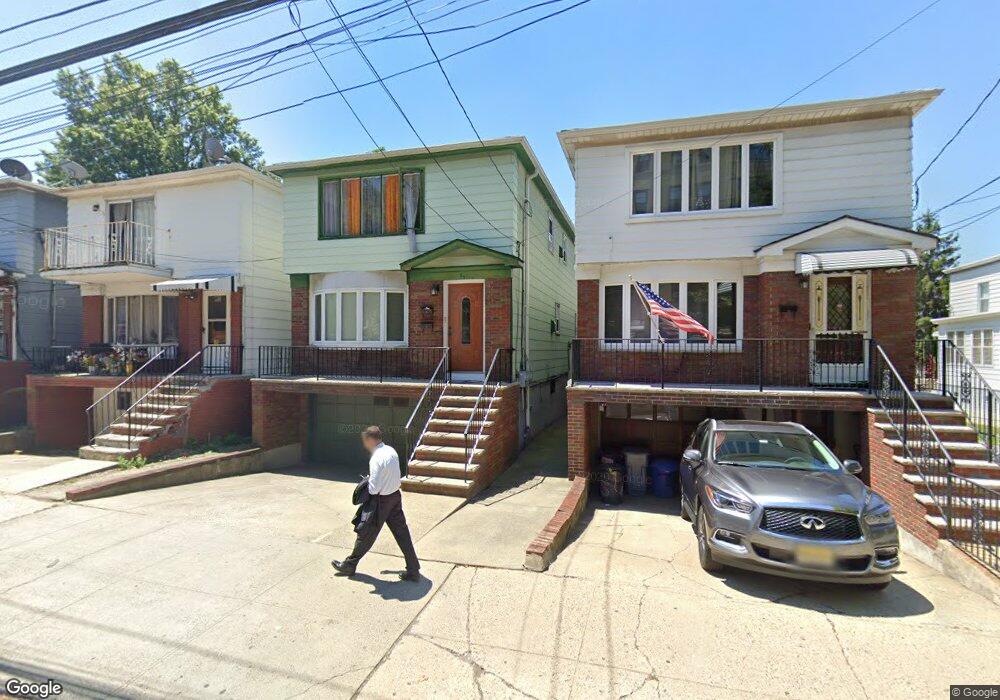
63 Magnolia Ave Jersey City, NJ 07306
Journal Square NeighborhoodEstimated Value: $823,000 - $1,405,000
4
Beds
--
Bath
2,136
Sq Ft
$526/Sq Ft
Est. Value
About This Home
This home is located at 63 Magnolia Ave, Jersey City, NJ 07306 and is currently estimated at $1,123,893, approximately $526 per square foot. 63 Magnolia Ave is a home located in Hudson County with nearby schools including Martin Luther King Jr. School - P.S. 11, William L. Dickinson High School, and Dr Ronald McNair High School.
Ownership History
Date
Name
Owned For
Owner Type
Purchase Details
Closed on
Oct 24, 2019
Sold by
Hee Vivienne and Lie Szelin
Bought by
Su John and Yuo Pui Kin
Current Estimated Value
Home Financials for this Owner
Home Financials are based on the most recent Mortgage that was taken out on this home.
Original Mortgage
$637,500
Outstanding Balance
$557,248
Interest Rate
3.5%
Mortgage Type
New Conventional
Estimated Equity
$566,645
Purchase Details
Closed on
Apr 19, 2007
Sold by
Ostergaard Alison and Tully Adam
Bought by
Hee Vivienne and Lie Szelin
Home Financials for this Owner
Home Financials are based on the most recent Mortgage that was taken out on this home.
Original Mortgage
$92,250
Interest Rate
6.23%
Mortgage Type
Credit Line Revolving
Purchase Details
Closed on
Jan 25, 2002
Sold by
Sapone Frank
Bought by
Andronaco Victoria
Create a Home Valuation Report for This Property
The Home Valuation Report is an in-depth analysis detailing your home's value as well as a comparison with similar homes in the area
Home Values in the Area
Average Home Value in this Area
Purchase History
| Date | Buyer | Sale Price | Title Company |
|---|---|---|---|
| Su John | $850,000 | Elite Title Group Llc | |
| Hee Vivienne | $615,000 | Fidelity Natl Title Ins Co | |
| Andronaco Victoria | -- | -- |
Source: Public Records
Mortgage History
| Date | Status | Borrower | Loan Amount |
|---|---|---|---|
| Open | Su John | $637,500 | |
| Previous Owner | Hee Vivienne | $92,250 | |
| Previous Owner | Hee Vivienne | $492,000 |
Source: Public Records
Tax History Compared to Growth
Tax History
| Year | Tax Paid | Tax Assessment Tax Assessment Total Assessment is a certain percentage of the fair market value that is determined by local assessors to be the total taxable value of land and additions on the property. | Land | Improvement |
|---|---|---|---|---|
| 2025 | $16,658 | $746,000 | $375,200 | $370,800 |
| 2024 | $16,763 | $746,000 | $375,200 | $370,800 |
| 2023 | $16,763 | $746,000 | $375,200 | $370,800 |
| 2022 | $15,800 | $746,000 | $375,200 | $370,800 |
| 2021 | $11,966 | $746,000 | $375,200 | $370,800 |
| 2020 | $12,011 | $746,000 | $375,200 | $370,800 |
| 2019 | $11,488 | $746,000 | $375,200 | $370,800 |
| 2018 | $1,957 | $746,000 | $375,200 | $370,800 |
| 2017 | $10,257 | $131,500 | $11,900 | $119,600 |
| 2016 | $10,127 | $131,500 | $11,900 | $119,600 |
| 2015 | $9,839 | $131,500 | $11,900 | $119,600 |
| 2014 | $9,776 | $131,500 | $11,900 | $119,600 |
Source: Public Records
Map
Nearby Homes
- 62 Henry St
- 54 Magnolia Ave Unit 1-5
- 126 Chestnut Ave
- 72 Henry St Unit 10B
- 492 Pavonia Ave Unit 3
- 447 Pavonia Ave Unit 3R
- 18 Elizabeth St
- 549 Pavonia Ave Unit 1 & 2
- 549 Pavonia Ave
- 551 Pavonia Ave Unit 1 &2
- 108 Waldo Ave Unit 1D
- 24 Perrine Ave
- 22 Perrine Ave Unit 2
- 614-616 Summit Ave
- 348 Baldwin Ave Unit 402
- 348 Baldwin Ave Unit 209
- 475-493 Newark Ave
- 374 Summit Ave
- 372 Summit Ave
- 191 Academy St
- 61 Magnolia Ave
- 61 Magnolia Ave Unit 2
- 63 Magnolia Ave Unit 2
- 65 Magnolia Ave
- 119 Chestnut Ave
- 59 Magnolia Ave
- 57 Magnolia Ave
- 55 Magnolia Ave
- 53 Magnolia Ave
- 53 Magnolia Ave Unit 1
- 53 Magnolia Ave Unit 2
- 69 Magnolia Ave
- 75 Magnolia Ave
- 117 Chestnut Ave
- 51 Magnolia Ave
- 51 Magnolia Ave Unit 2
- 51 Magnolia Ave Unit 1
- 113 Chestnut Ave
- 52 Henry St
- 111 Chestnut Ave