Estimated Value: $915,428
Studio
2
Baths
5,492
Sq Ft
$167/Sq Ft
Est. Value
About This Home
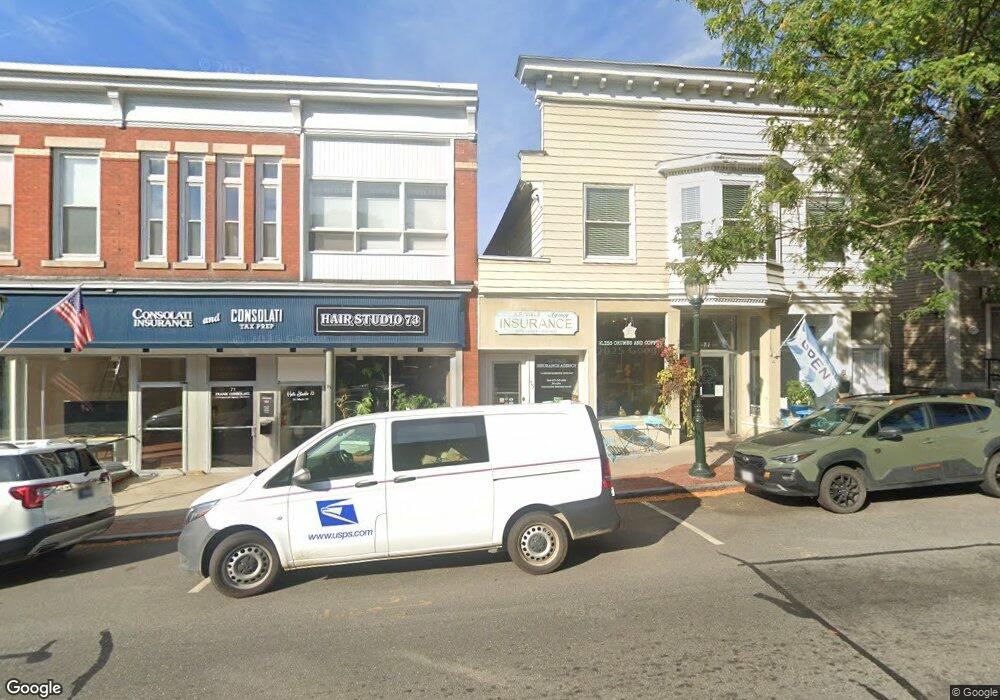
This home is located at 63 Main St, Lee, MA 01238 and is currently estimated at $915,428, approximately $166 per square foot. 63 Main St is a home located in Berkshire County with nearby schools including Lee Elementary School, Lee Middle/High School, and St. Mary's School.
Ownership History
Date
Name
Owned For
Owner Type
Purchase Details
Closed on
Nov 17, 2020
Sold by
Cohen Group Llc
Bought by
Phase 4 Llc
Current Estimated Value
Home Financials for this Owner
Home Financials are based on the most recent Mortgage that was taken out on this home.
Original Mortgage
$414,000
Outstanding Balance
$365,023
Interest Rate
2.8%
Mortgage Type
New Conventional
Estimated Equity
$550,405
Purchase Details
Closed on
Jul 8, 2008
Sold by
Mars Hill Nt and Effron
Bought by
Cohen Group Llc
Home Financials for this Owner
Home Financials are based on the most recent Mortgage that was taken out on this home.
Original Mortgage
$25,000
Interest Rate
6.01%
Mortgage Type
Commercial
Purchase Details
Closed on
Sep 9, 2002
Sold by
Bartini Robert J
Bought by
Mars Hill Nt and Effron
Purchase Details
Closed on
Sep 28, 2001
Sold by
Salinetti Suzanne K
Bought by
Bartini Robert J
Purchase Details
Closed on
Jan 13, 2000
Sold by
Tjs Nt and Salinetti
Bought by
Salinetti Suzanne K
Purchase Details
Closed on
May 5, 1995
Sold by
Coyne Edward M
Bought by
Bean William M and Bean Elizabeth J
Purchase Details
Closed on
Feb 12, 1993
Sold by
Est Viale Richard M and Viale Peter R
Bought by
Tjs Nt and Salinetti Michael J
Create a Home Valuation Report for This Property
The Home Valuation Report is an in-depth analysis detailing your home's value as well as a comparison with similar homes in the area
Home Values in the Area
Average Home Value in this Area
Purchase History
| Date | Buyer | Sale Price | Title Company |
|---|---|---|---|
| Phase 4 Llc | -- | None Available | |
| Phase 4 Llc | -- | None Available | |
| Phase 4 Llc | -- | None Available | |
| Cohen Group Llc | $425,000 | -- | |
| Cohen Group Llc | $425,000 | -- | |
| Cohen Group Llc | $425,000 | -- | |
| Mars Hill Nt | $217,075 | -- | |
| Mars Hill Nt | $217,075 | -- | |
| Bartini Robert J | $160,000 | -- | |
| Bartini Robert J | $160,000 | -- | |
| Salinetti Suzanne K | $80,000 | -- | |
| Salinetti Suzanne K | $80,000 | -- | |
| Bean William M | $76,250 | -- | |
| Bean William M | $76,250 | -- | |
| Bean William M | $76,250 | -- | |
| Tjs Nt | $127,500 | -- |
Source: Public Records
Mortgage History
| Date | Status | Borrower | Loan Amount |
|---|---|---|---|
| Open | Phase 4 Llc | $414,000 | |
| Closed | Phase 4 Llc | $166,000 | |
| Closed | Phase 4 Llc | $414,000 | |
| Previous Owner | Cohen Group Llc | $25,000 |
Source: Public Records
Tax History
| Year | Tax Paid | Tax Assessment Tax Assessment Total Assessment is a certain percentage of the fair market value that is determined by local assessors to be the total taxable value of land and additions on the property. | Land | Improvement |
|---|---|---|---|---|
| 2025 | $5,229 | $464,800 | $134,400 | $330,400 |
| 2024 | $5,138 | $457,100 | $126,700 | $330,400 |
| 2023 | $5,405 | $456,900 | $109,200 | $347,700 |
| 2022 | $5,415 | $396,700 | $97,500 | $299,200 |
| 2021 | $5,768 | $392,900 | $93,700 | $299,200 |
| 2020 | $5,715 | $389,300 | $93,500 | $295,800 |
| 2019 | $5,754 | $389,300 | $93,500 | $295,800 |
| 2018 | $5,665 | $387,200 | $91,400 | $295,800 |
| 2017 | $5,654 | $384,100 | $88,400 | $295,700 |
| 2016 | $5,592 | $384,100 | $88,400 | $295,700 |
| 2015 | $5,408 | $384,100 | $88,400 | $295,700 |
| 2014 | $4,907 | $346,800 | $84,000 | $262,800 |
Source: Public Records
Map
Nearby Homes
- 160 High St
- 205 High St
- 180 Center St
- 30 Pease Terrace
- 46 Pease Terrace
- 155 Laurel St
- 2 Devon Rd
- 290 E Center St
- 135 East St
- 0 East St Unit 235893
- 140 Theresa Terrace
- 45 Forest St
- 615 Laurel St
- 560 Stockbridge Rd
- 528 Walker St
- 524 Walker St
- 500 Walker St
- 82 Stockbridge Terrace
- 62 Stockbridge Terrace
- 770 Summer St Unit 5D