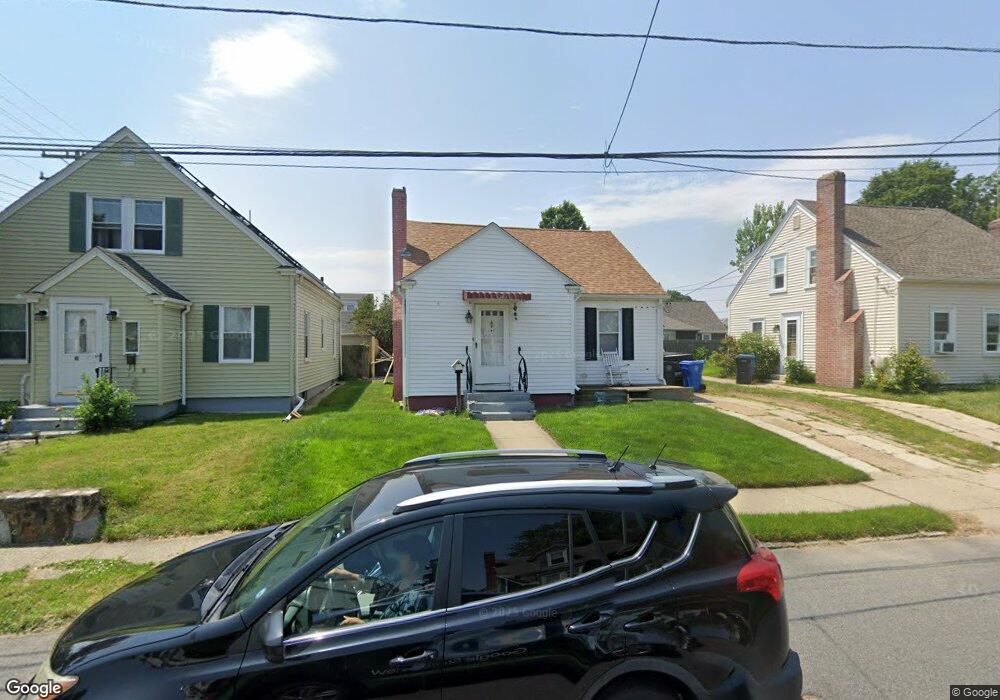
63 Pershing St Cranston, RI 02910
Stadium NeighborhoodEstimated Value: $344,000 - $393,000
3
Beds
1
Bath
1,464
Sq Ft
$250/Sq Ft
Est. Value
About This Home
This home is located at 63 Pershing St, Cranston, RI 02910 and is currently estimated at $366,687, approximately $250 per square foot. 63 Pershing St is a home located in Providence County with nearby schools including Stadium Elementary School, Hugh B. Bain Middle School, and Cranston High School East.
Ownership History
Date
Name
Owned For
Owner Type
Purchase Details
Closed on
Aug 11, 2023
Sold by
Didonato Daniel and Didonato Robin
Bought by
Didonato Daniel
Current Estimated Value
Home Financials for this Owner
Home Financials are based on the most recent Mortgage that was taken out on this home.
Original Mortgage
$221,500
Outstanding Balance
$216,017
Interest Rate
6.81%
Mortgage Type
New Conventional
Estimated Equity
$150,670
Purchase Details
Closed on
May 6, 2011
Sold by
Associats Birdsong
Bought by
Didonato Daniel and Didonato Robin
Purchase Details
Closed on
Jul 31, 2001
Sold by
Chin Harry
Bought by
Didonato Daniel
Home Financials for this Owner
Home Financials are based on the most recent Mortgage that was taken out on this home.
Original Mortgage
$88,950
Interest Rate
7.18%
Create a Home Valuation Report for This Property
The Home Valuation Report is an in-depth analysis detailing your home's value as well as a comparison with similar homes in the area
Home Values in the Area
Average Home Value in this Area
Purchase History
| Date | Buyer | Sale Price | Title Company |
|---|---|---|---|
| Didonato Daniel | -- | None Available | |
| Didonato Daniel | -- | None Available | |
| Didonato Daniel | -- | -- | |
| Didonato Daniel | $90,000 | -- | |
| Didonato Daniel | -- | -- | |
| Didonato Daniel | $90,000 | -- |
Source: Public Records
Mortgage History
| Date | Status | Borrower | Loan Amount |
|---|---|---|---|
| Open | Didonato Daniel | $221,500 | |
| Closed | Didonato Daniel | $221,500 | |
| Previous Owner | Didonato Daniel | $25,000 | |
| Previous Owner | Didonato Daniel | $12,500 | |
| Previous Owner | Didonato Daniel | $88,950 |
Source: Public Records
Tax History Compared to Growth
Tax History
| Year | Tax Paid | Tax Assessment Tax Assessment Total Assessment is a certain percentage of the fair market value that is determined by local assessors to be the total taxable value of land and additions on the property. | Land | Improvement |
|---|---|---|---|---|
| 2025 | $3,989 | $287,400 | $92,100 | $195,300 |
| 2024 | $3,856 | $283,300 | $92,100 | $191,200 |
| 2023 | $3,742 | $198,000 | $63,500 | $134,500 |
| 2022 | $3,665 | $198,000 | $63,500 | $134,500 |
| 2021 | $3,564 | $198,000 | $63,500 | $134,500 |
| 2020 | $3,255 | $156,700 | $60,300 | $96,400 |
| 2019 | $3,255 | $156,700 | $60,300 | $96,400 |
| 2018 | $3,179 | $156,700 | $60,300 | $96,400 |
| 2017 | $2,879 | $125,500 | $44,500 | $81,000 |
| 2016 | $2,817 | $125,500 | $44,500 | $81,000 |
| 2015 | $2,817 | $125,500 | $44,500 | $81,000 |
| 2014 | $2,882 | $126,200 | $44,500 | $81,700 |
Source: Public Records
Map
Nearby Homes