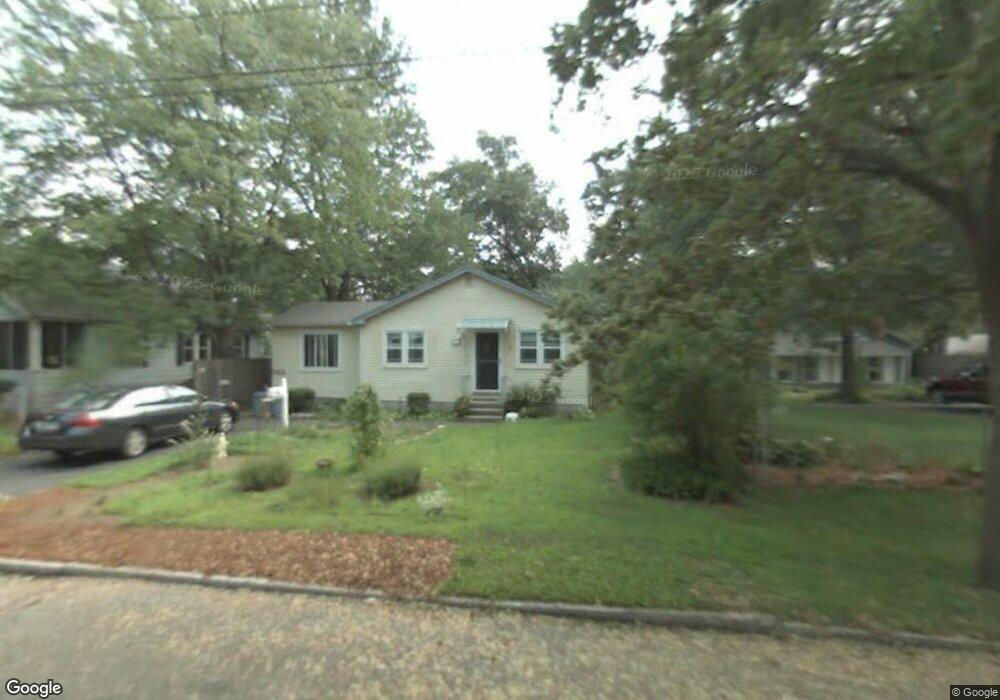
63 Rosella St Springfield, MA 01118
East Forest Park NeighborhoodEstimated Value: $286,644 - $315,000
3
Beds
1
Bath
1,104
Sq Ft
$272/Sq Ft
Est. Value
About This Home
This home is located at 63 Rosella St, Springfield, MA 01118 and is currently estimated at $300,161, approximately $271 per square foot. 63 Rosella St is a home located in Hampden County with nearby schools including Mary A. Dryden Veterans Memorial School, M Marcus Kiley Middle, and Springfield High School of Science and Technology.
Ownership History
Date
Name
Owned For
Owner Type
Purchase Details
Closed on
Jul 28, 1998
Sold by
Bouchard Wini L
Bought by
Gardner Mary E
Current Estimated Value
Purchase Details
Closed on
Aug 27, 1987
Sold by
Vivenzio John A
Bought by
Bouchard Patrick J
Create a Home Valuation Report for This Property
The Home Valuation Report is an in-depth analysis detailing your home's value as well as a comparison with similar homes in the area
Home Values in the Area
Average Home Value in this Area
Purchase History
| Date | Buyer | Sale Price | Title Company |
|---|---|---|---|
| Gardner Mary E | $80,000 | -- | |
| Bouchard Patrick J | $96,000 | -- |
Source: Public Records
Mortgage History
| Date | Status | Borrower | Loan Amount |
|---|---|---|---|
| Open | Bouchard Patrick J | $15,597 | |
| Closed | Bouchard Patrick J | $10,227 |
Source: Public Records
Tax History
| Year | Tax Paid | Tax Assessment Tax Assessment Total Assessment is a certain percentage of the fair market value that is determined by local assessors to be the total taxable value of land and additions on the property. | Land | Improvement |
|---|---|---|---|---|
| 2025 | $4,036 | $257,400 | $45,200 | $212,200 |
| 2024 | $3,514 | $218,800 | $45,200 | $173,600 |
| 2023 | $3,696 | $216,800 | $43,100 | $173,700 |
| 2022 | $3,173 | $168,600 | $43,100 | $125,500 |
| 2021 | $3,105 | $164,300 | $39,200 | $125,100 |
| 2020 | $2,955 | $151,300 | $39,200 | $112,100 |
| 2019 | $2,840 | $144,300 | $39,200 | $105,100 |
| 2018 | $2,826 | $143,600 | $39,200 | $104,400 |
| 2017 | $2,790 | $141,900 | $39,200 | $102,700 |
| 2016 | $2,515 | $127,900 | $39,200 | $88,700 |
| 2015 | $2,474 | $125,800 | $39,200 | $86,600 |
Source: Public Records
Map
Nearby Homes
Your Personal Tour Guide
Ask me questions while you tour the home.