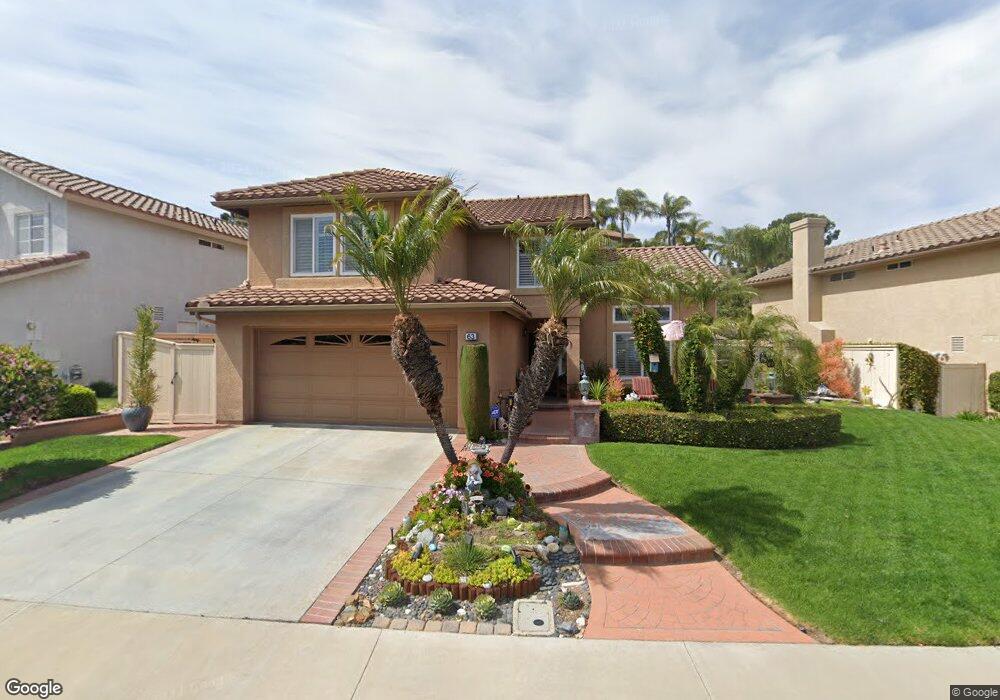
63 Shorecliff Aliso Viejo, CA 92656
Estimated Value: $1,465,000 - $1,512,000
4
Beds
3
Baths
1,806
Sq Ft
$824/Sq Ft
Est. Value
About This Home
This home is located at 63 Shorecliff, Aliso Viejo, CA 92656 and is currently estimated at $1,487,864, approximately $823 per square foot. 63 Shorecliff is a home located in Orange County with nearby schools including Don Juan Avila Middle School, Aliso Niguel High School, and Journey.
Ownership History
Date
Name
Owned For
Owner Type
Purchase Details
Closed on
Feb 24, 2021
Sold by
Griffin James W and Family Tr Of James W Griffin
Bought by
Griffin James W and Walton Mary E
Current Estimated Value
Home Financials for this Owner
Home Financials are based on the most recent Mortgage that was taken out on this home.
Original Mortgage
$218,000
Outstanding Balance
$195,422
Interest Rate
2.7%
Mortgage Type
New Conventional
Estimated Equity
$1,292,442
Purchase Details
Closed on
Apr 20, 2016
Sold by
Griffin James W
Bought by
Griffin James W and The Family Trust Of James W Griffin & Ma
Purchase Details
Closed on
Nov 25, 2001
Sold by
Griffin James W and Walton Mary E
Bought by
Griffin James W
Home Financials for this Owner
Home Financials are based on the most recent Mortgage that was taken out on this home.
Original Mortgage
$265,000
Interest Rate
6.63%
Create a Home Valuation Report for This Property
The Home Valuation Report is an in-depth analysis detailing your home's value as well as a comparison with similar homes in the area
Home Values in the Area
Average Home Value in this Area
Purchase History
| Date | Buyer | Sale Price | Title Company |
|---|---|---|---|
| Griffin James W | -- | Timios Title A Ca Corp | |
| Griffin James W | -- | None Available | |
| Griffin James W | -- | Southland Title Corporation |
Source: Public Records
Mortgage History
| Date | Status | Borrower | Loan Amount |
|---|---|---|---|
| Open | Griffin James W | $218,000 | |
| Previous Owner | Griffin James W | $265,000 |
Source: Public Records
Tax History Compared to Growth
Tax History
| Year | Tax Paid | Tax Assessment Tax Assessment Total Assessment is a certain percentage of the fair market value that is determined by local assessors to be the total taxable value of land and additions on the property. | Land | Improvement |
|---|---|---|---|---|
| 2025 | $4,624 | $473,387 | $210,817 | $262,570 |
| 2024 | $4,624 | $464,105 | $206,683 | $257,422 |
| 2023 | $4,516 | $455,005 | $202,630 | $252,375 |
| 2022 | $4,427 | $446,084 | $198,657 | $247,427 |
| 2021 | $4,338 | $437,338 | $194,762 | $242,576 |
| 2020 | $4,293 | $432,854 | $192,765 | $240,089 |
| 2019 | $4,208 | $424,367 | $188,985 | $235,382 |
| 2018 | $4,124 | $416,047 | $185,280 | $230,767 |
| 2017 | $4,042 | $407,890 | $181,647 | $226,243 |
| 2016 | $3,931 | $399,893 | $178,086 | $221,807 |
| 2015 | $4,590 | $393,887 | $175,411 | $218,476 |
| 2014 | $4,501 | $386,172 | $171,975 | $214,197 |
Source: Public Records
Map
Nearby Homes
- 29 Sandbridge
- 246 Woodcrest Ln Unit 147
- 2 Carlsbad Ln Unit 179
- 92 Verdin Ln
- 36 Baneberry
- 28 Conch Reef
- 11 Summerwood
- 32 Rockrose
- 6 Summerwood
- 22 Cayman Brac
- 46 Conch Reef Unit 36
- 15 Harvest Point Ln
- 31 Cayman Brac
- 40 Golf Dr
- 8 Ashwood
- 15 Elmbrook Unit 52
- 47 Solitaire Ln
- 20 Richemont Way
- 66 Elderwood
- 17 Via Athena Unit 49