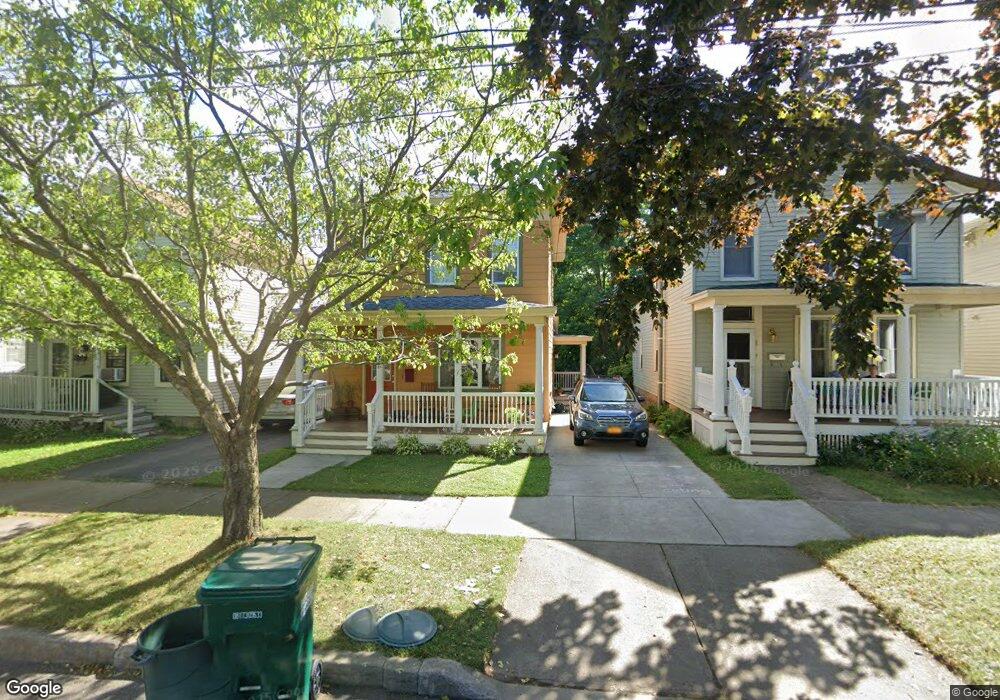
63 W 3rd St Oswego, NY 13126
Estimated Value: $117,000 - $183,000
2
Beds
2
Baths
1,280
Sq Ft
$108/Sq Ft
Est. Value
About This Home
This home is located at 63 W 3rd St, Oswego, NY 13126 and is currently estimated at $137,789, approximately $107 per square foot. 63 W 3rd St is a home located in Oswego County with nearby schools including Leighton Elementary School, Oswego Middle School, and Oswego High School.
Ownership History
Date
Name
Owned For
Owner Type
Purchase Details
Closed on
Mar 30, 2018
Sold by
Briglin Cynthia M and Briglin Lynn
Bought by
Cocks Richard M and Djukic Cocks Ana
Current Estimated Value
Home Financials for this Owner
Home Financials are based on the most recent Mortgage that was taken out on this home.
Original Mortgage
$98,500
Outstanding Balance
$84,629
Interest Rate
4.4%
Mortgage Type
Construction
Estimated Equity
$53,160
Purchase Details
Closed on
Aug 29, 2001
Sold by
Moryl Veronica
Bought by
Moryl Dennis
Create a Home Valuation Report for This Property
The Home Valuation Report is an in-depth analysis detailing your home's value as well as a comparison with similar homes in the area
Home Values in the Area
Average Home Value in this Area
Purchase History
| Date | Buyer | Sale Price | Title Company |
|---|---|---|---|
| Cocks Richard M | $66,000 | None Available | |
| Moryl Dennis | -- | -- |
Source: Public Records
Mortgage History
| Date | Status | Borrower | Loan Amount |
|---|---|---|---|
| Open | Cocks Richard M | $98,500 |
Source: Public Records
Tax History
| Year | Tax Paid | Tax Assessment Tax Assessment Total Assessment is a certain percentage of the fair market value that is determined by local assessors to be the total taxable value of land and additions on the property. | Land | Improvement |
|---|---|---|---|---|
| 2024 | $1,869 | $100,000 | $18,600 | $81,400 |
| 2023 | $1,823 | $70,000 | $9,100 | $60,900 |
| 2022 | $1,848 | $70,000 | $9,100 | $60,900 |
| 2021 | $1,880 | $70,000 | $9,100 | $60,900 |
| 2020 | $1,328 | $70,000 | $9,100 | $60,900 |
| 2019 | $2,178 | $70,000 | $9,100 | $60,900 |
| 2018 | $2,178 | $70,000 | $9,100 | $60,900 |
| 2017 | $1,388 | $70,000 | $9,100 | $60,900 |
| 2016 | $389 | $54,000 | $9,100 | $44,900 |
| 2015 | -- | $54,000 | $9,100 | $44,900 |
| 2014 | -- | $54,000 | $9,100 | $44,900 |
Source: Public Records
Map
Nearby Homes
Your Personal Tour Guide
Ask me questions while you tour the home.