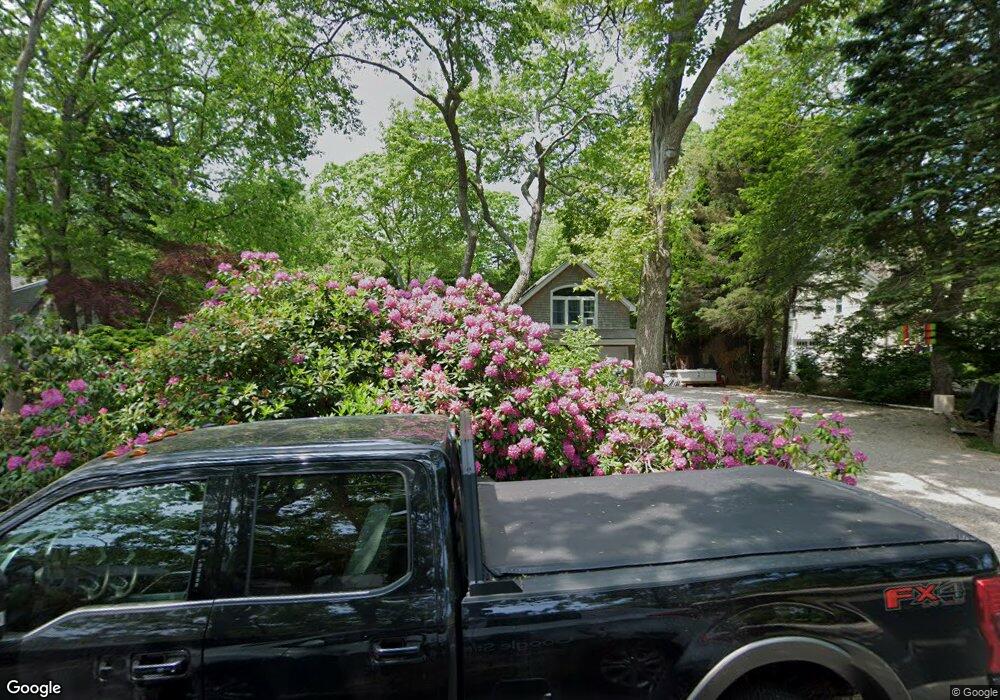
63 Wagner Rd Westerly, RI 02891
Estimated Value: $929,000 - $1,134,000
2
Beds
2
Baths
1,524
Sq Ft
$665/Sq Ft
Est. Value
About This Home
This home is located at 63 Wagner Rd, Westerly, RI 02891 and is currently estimated at $1,013,358, approximately $664 per square foot. 63 Wagner Rd is a home with nearby schools including Westerly High School.
Ownership History
Date
Name
Owned For
Owner Type
Purchase Details
Closed on
Aug 15, 2025
Sold by
Visnaukas Phyllis J Est and Preuss
Bought by
Preuss Eric and Preuss Amy E
Current Estimated Value
Purchase Details
Closed on
Mar 2, 2016
Sold by
Visnauskas Phyllis J
Bought by
Visnauskas Phyllis J
Purchase Details
Closed on
Sep 5, 2014
Sold by
Visnauskas John W and Visnauskas Phyllis J
Bought by
Visnauskas Phyllis J
Purchase Details
Closed on
Jun 25, 1979
Bought by
Visnauskas Phyllis J
Create a Home Valuation Report for This Property
The Home Valuation Report is an in-depth analysis detailing your home's value as well as a comparison with similar homes in the area
Home Values in the Area
Average Home Value in this Area
Purchase History
| Date | Buyer | Sale Price | Title Company |
|---|---|---|---|
| Preuss Eric | $925,000 | -- | |
| Preuss Eric | $925,000 | -- | |
| Preuss Eric | $925,000 | -- | |
| Visnauskas Phyllis J | -- | -- | |
| Visnauskas Phyllis J | -- | -- | |
| Visnauskas Phyllis J | -- | -- | |
| Visnauskas Phyllis J | -- | -- | |
| Visnauskas Phyllis J | -- | -- |
Source: Public Records
Mortgage History
| Date | Status | Borrower | Loan Amount |
|---|---|---|---|
| Previous Owner | Visnauskas Phyllis J | $464,000 | |
| Previous Owner | Visnauskas Phyllis J | $50,000 |
Source: Public Records
Tax History
| Year | Tax Paid | Tax Assessment Tax Assessment Total Assessment is a certain percentage of the fair market value that is determined by local assessors to be the total taxable value of land and additions on the property. | Land | Improvement |
|---|---|---|---|---|
| 2025 | $6,738 | $947,700 | $648,600 | $299,100 |
| 2024 | $6,928 | $706,200 | $463,200 | $243,000 |
| 2023 | $6,794 | $706,200 | $463,200 | $243,000 |
| 2022 | $6,751 | $706,200 | $463,200 | $243,000 |
| 2021 | $6,065 | $526,500 | $332,400 | $194,100 |
| 2020 | $5,955 | $526,500 | $332,400 | $194,100 |
| 2019 | $5,897 | $526,500 | $332,400 | $194,100 |
| 2018 | $5,491 | $462,200 | $302,200 | $160,000 |
| 2017 | $5,357 | $462,200 | $302,200 | $160,000 |
| 2016 | $5,398 | $462,200 | $302,200 | $160,000 |
| 2015 | $5,225 | $482,900 | $308,400 | $174,500 |
| 2014 | $5,138 | $482,900 | $308,400 | $174,500 |
Source: Public Records
Map
Nearby Homes
- 346 Post Rd
- 137 Cove Point Rd E
- 342 Post Rd
- 14 Evergreen Ln
- 853 W Beach Rd
- 43 Noyes Neck Rd
- 5 Robin Hollow Ln
- 112 Noyes Neck Rd
- 11 Bucks Trail
- 7 Fenway Rd
- 135 Ross Hill Rd
- 34 Buddington Rd
- 143 Ross Hill Rd
- 15 Breach Dr
- 5717 Post Rd
- 22 Breach Dr
- 30 Clifford Dr
- 20 Snowberry Ln
- 46 Salt Pond Way
- 13 Plateau Rd
Your Personal Tour Guide
Ask me questions while you tour the home.