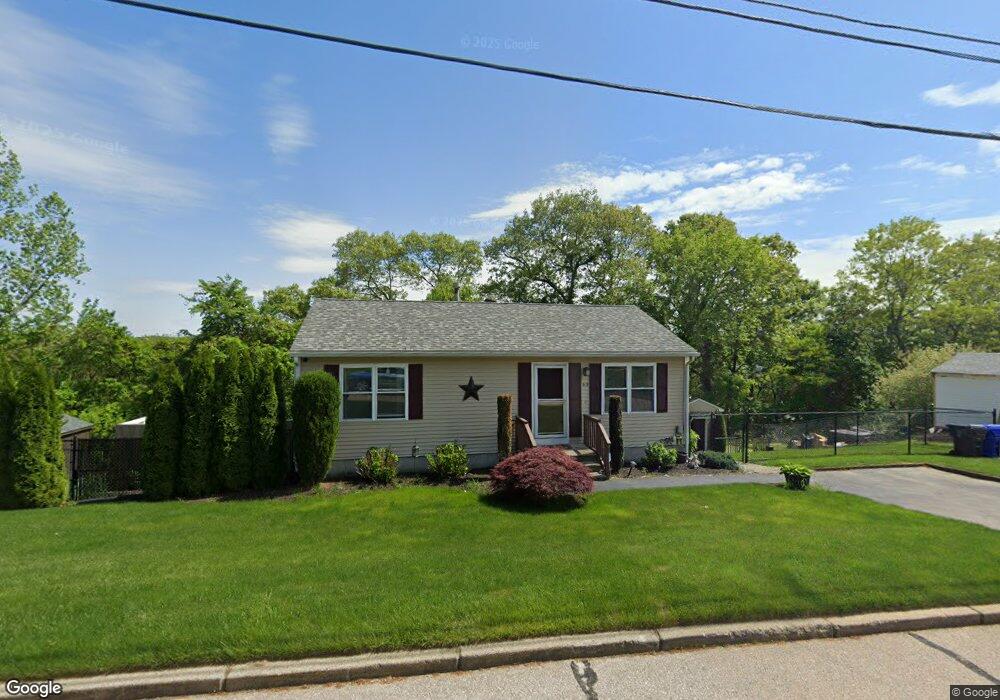
63 Wightman St West Warwick, RI 02893
Lippitt-Harris NeighborhoodEstimated Value: $386,934 - $407,000
3
Beds
2
Baths
1,716
Sq Ft
$229/Sq Ft
Est. Value
About This Home
This home is located at 63 Wightman St, West Warwick, RI 02893 and is currently estimated at $393,234, approximately $229 per square foot. 63 Wightman St is a home located in Kent County with nearby schools including West Warwick High School, St Joseph School, and Islamic School of Rhode Island.
Ownership History
Date
Name
Owned For
Owner Type
Purchase Details
Closed on
Mar 15, 2024
Sold by
Campisani Daniel K
Bought by
Daniel K Campisani T K and Daniel Campisani
Current Estimated Value
Purchase Details
Closed on
May 2, 2001
Sold by
Lavallee Leo H and Lavallee Louise L
Bought by
Campisani Daniel K
Home Financials for this Owner
Home Financials are based on the most recent Mortgage that was taken out on this home.
Original Mortgage
$140,298
Interest Rate
6.85%
Mortgage Type
Purchase Money Mortgage
Create a Home Valuation Report for This Property
The Home Valuation Report is an in-depth analysis detailing your home's value as well as a comparison with similar homes in the area
Home Values in the Area
Average Home Value in this Area
Purchase History
| Date | Buyer | Sale Price | Title Company |
|---|---|---|---|
| Daniel K Campisani T K | -- | None Available | |
| Campisani Daniel K | $143,000 | -- |
Source: Public Records
Mortgage History
| Date | Status | Borrower | Loan Amount |
|---|---|---|---|
| Previous Owner | Campisani Daniel K | $220,000 | |
| Previous Owner | Campisani Daniel K | $10,358 | |
| Previous Owner | Campisani Daniel K | $140,273 | |
| Previous Owner | Campisani Daniel K | $140,298 |
Source: Public Records
Tax History
| Year | Tax Paid | Tax Assessment Tax Assessment Total Assessment is a certain percentage of the fair market value that is determined by local assessors to be the total taxable value of land and additions on the property. | Land | Improvement |
|---|---|---|---|---|
| 2025 | $4,327 | $302,800 | $91,500 | $211,300 |
| 2024 | $4,459 | $238,600 | $74,800 | $163,800 |
| 2023 | $4,371 | $238,600 | $74,800 | $163,800 |
| 2022 | $4,304 | $238,600 | $74,800 | $163,800 |
| 2021 | $4,269 | $185,600 | $62,900 | $122,700 |
| 2020 | $4,269 | $185,600 | $62,900 | $122,700 |
| 2019 | $5,442 | $185,600 | $62,900 | $122,700 |
| 2018 | $3,998 | $147,100 | $60,100 | $87,000 |
| 2017 | $3,870 | $147,100 | $60,100 | $87,000 |
| 2016 | $3,801 | $147,100 | $60,100 | $87,000 |
| 2015 | $3,702 | $142,600 | $60,100 | $82,500 |
| 2014 | $3,621 | $142,600 | $60,100 | $82,500 |
Source: Public Records
Map
Nearby Homes
Your Personal Tour Guide
Ask me questions while you tour the home.