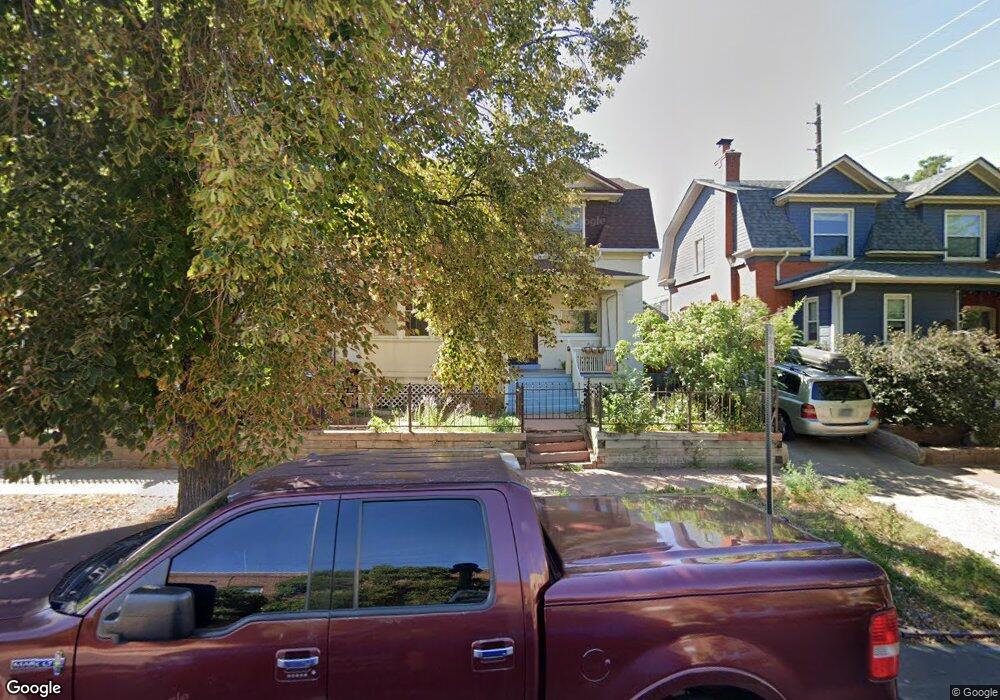
630 E 12th Ave Denver, CO 80203
Capitol Hill NeighborhoodEstimated Value: $631,000 - $807,000
2
Beds
2
Baths
2,492
Sq Ft
$282/Sq Ft
Est. Value
About This Home
This home is located at 630 E 12th Ave, Denver, CO 80203 and is currently estimated at $703,169, approximately $282 per square foot. 630 E 12th Ave is a home located in Denver County with nearby schools including Dora Moore ECE-8 School, Morey Middle School, and East High School.
Ownership History
Date
Name
Owned For
Owner Type
Purchase Details
Closed on
Sep 3, 2020
Sold by
Acres Richard C and Parker Kelly A
Bought by
Acres Richard C and Acres Kelly A
Current Estimated Value
Home Financials for this Owner
Home Financials are based on the most recent Mortgage that was taken out on this home.
Original Mortgage
$510,000
Outstanding Balance
$452,591
Interest Rate
2.9%
Mortgage Type
New Conventional
Estimated Equity
$250,578
Purchase Details
Closed on
Apr 7, 2017
Sold by
Bice Lola R
Bought by
Acres Richard C and Parker Kelly A
Home Financials for this Owner
Home Financials are based on the most recent Mortgage that was taken out on this home.
Original Mortgage
$493,000
Interest Rate
4.16%
Mortgage Type
New Conventional
Purchase Details
Closed on
Apr 11, 2014
Sold by
Krukoff John and Kapushion Meredith
Bought by
Bice Lola R
Home Financials for this Owner
Home Financials are based on the most recent Mortgage that was taken out on this home.
Original Mortgage
$125,000
Interest Rate
3.75%
Mortgage Type
Adjustable Rate Mortgage/ARM
Purchase Details
Closed on
Jul 20, 2007
Sold by
Duba M Catherine
Bought by
Krukoff John and Kapushion Meredith
Home Financials for this Owner
Home Financials are based on the most recent Mortgage that was taken out on this home.
Original Mortgage
$228,400
Interest Rate
6.62%
Mortgage Type
New Conventional
Purchase Details
Closed on
Oct 29, 1996
Sold by
Ford Consumer Finance Company Inc
Bought by
Duba M Catherine
Home Financials for this Owner
Home Financials are based on the most recent Mortgage that was taken out on this home.
Original Mortgage
$108,696
Interest Rate
8.17%
Mortgage Type
FHA
Purchase Details
Closed on
Oct 25, 1996
Sold by
Leon Brooks
Bought by
Ford Consumer Finance Company Inc
Home Financials for this Owner
Home Financials are based on the most recent Mortgage that was taken out on this home.
Original Mortgage
$108,696
Interest Rate
8.17%
Mortgage Type
FHA
Purchase Details
Closed on
Apr 6, 1995
Sold by
Leon Brooks Inc
Bought by
Brooks Leon
Home Financials for this Owner
Home Financials are based on the most recent Mortgage that was taken out on this home.
Original Mortgage
$12,907
Interest Rate
8.48%
Purchase Details
Closed on
Oct 27, 1994
Sold by
Leon Brooks Inc
Bought by
Brooks Leon
Home Financials for this Owner
Home Financials are based on the most recent Mortgage that was taken out on this home.
Original Mortgage
$104,404
Interest Rate
8.73%
Purchase Details
Closed on
Dec 13, 1993
Sold by
Brooks Leon
Bought by
Anderson Michael J
Create a Home Valuation Report for This Property
The Home Valuation Report is an in-depth analysis detailing your home's value as well as a comparison with similar homes in the area
Home Values in the Area
Average Home Value in this Area
Purchase History
| Date | Buyer | Sale Price | Title Company |
|---|---|---|---|
| Acres Richard C | -- | Fidelity National Title Co | |
| Acres Richard C | $520,000 | Land Title Guarantee | |
| Bice Lola R | $395,000 | Land Title Guarantee Company | |
| Krukoff John | $285,500 | Land Title Guarantee Company | |
| Duba M Catherine | $109,500 | -- | |
| Ford Consumer Finance Company Inc | -- | -- | |
| Brooks Leon | -- | -- | |
| Brooks Leon | -- | First American Heritage Titl | |
| Leon Brooks Inc | -- | First American Heritage Titl | |
| Anderson Michael J | $110,000 | -- |
Source: Public Records
Mortgage History
| Date | Status | Borrower | Loan Amount |
|---|---|---|---|
| Open | Acres Richard C | $510,000 | |
| Closed | Acres Richard C | $493,000 | |
| Previous Owner | Bice Lola R | $125,000 | |
| Previous Owner | Krukoff John | $228,400 | |
| Previous Owner | Duba M Catherine | $108,696 | |
| Previous Owner | Brooks Leon | $12,907 | |
| Previous Owner | Brooks Leon | $104,404 |
Source: Public Records
Tax History Compared to Growth
Tax History
| Year | Tax Paid | Tax Assessment Tax Assessment Total Assessment is a certain percentage of the fair market value that is determined by local assessors to be the total taxable value of land and additions on the property. | Land | Improvement |
|---|---|---|---|---|
| 2024 | $2,865 | $36,170 | $6,760 | $29,410 |
| 2023 | $2,803 | $36,170 | $6,760 | $29,410 |
| 2022 | $2,429 | $30,540 | $10,840 | $19,700 |
| 2021 | $2,429 | $31,420 | $11,150 | $20,270 |
| 2020 | $2,877 | $38,770 | $10,450 | $28,320 |
| 2019 | $2,796 | $38,770 | $10,450 | $28,320 |
| 2018 | $2,312 | $29,890 | $9,820 | $20,070 |
| 2017 | $2,306 | $29,890 | $9,820 | $20,070 |
| 2016 | $2,492 | $30,560 | $10,085 | $20,475 |
| 2015 | $2,388 | $30,560 | $10,085 | $20,475 |
| 2014 | $1,566 | $18,850 | $5,803 | $13,047 |
Source: Public Records
Map
Nearby Homes
- 1214 N Pearl St Unit 1
- 1125 N Washington St Unit 501
- 1125 N Washington St Unit 206
- 1125 N Washington St Unit 602
- 1113 N Washington St
- 550 E 12th Ave Unit 907
- 550 E 12th Ave Unit 1706
- 550 E 12th Ave Unit 506
- 1243 N Washington St Unit 308
- 1243 N Washington St Unit 406
- 1243 N Washington St Unit 105
- 1225 N Clarkson St
- 1130 N Pennsylvania St Unit 307
- 1130 N Pennsylvania St Unit 306
- 1266 N Pearl St
- 1165 N Pennsylvania St Unit 3B
- 1060 N Washington St Unit 1A
- 500 E 11th Ave Unit 102
- 500 E 11th Ave Unit 101
- 500 E 11th Ave Unit 201
- 638 E 12th Ave
- 624 E 12th Ave
- 624 E 12th Ave
- 624 E 12th Ave Unit B
- 1163 Washington St
- 1161 Washington St Unit 103
- 1161 Washington St Unit 102
- 1161 Washington St Unit 101
- 1161 N Washington St Unit 103
- 1143 Washington St
- 608 E 12th Ave
- 1205 Washington St
- 1205 N Washington St
- 1141 Washington St
- 1148 N Washington St
- 1200 Pearl St
- 1144 Pearl St
- 1142 Washington St
- 1125 Washington St Unit 606
- 1125 Washington St Unit 605