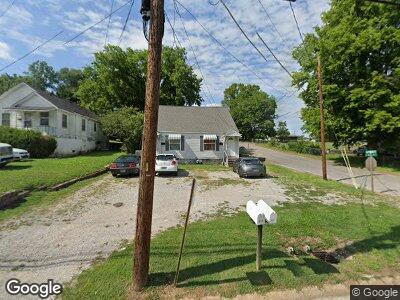
630 E Jefferson St Unit 632 Pulaski, TN 38478
Estimated Value: $92,475 - $228,000
4
Beds
2
Baths
2,544
Sq Ft
$57/Sq Ft
Est. Value
About This Home
This home is located at 630 E Jefferson St Unit 632, Pulaski, TN 38478 and is currently estimated at $144,869, approximately $56 per square foot. 630 E Jefferson St Unit 632 is a home located in Giles County with nearby schools including Pulaski Elementary School, Southside Elementary School, and Bridgeforth Middle School.
Ownership History
Date
Name
Owned For
Owner Type
Purchase Details
Closed on
Aug 8, 2022
Sold by
Barber Kent S
Bought by
Wilson Jimmy and Mansfield Eric
Current Estimated Value
Purchase Details
Closed on
Feb 6, 2013
Sold by
Gilbert Mark A
Bought by
Barber Kent S
Purchase Details
Closed on
Nov 4, 1997
Sold by
Ingram Lisa K
Bought by
Coffey Robert E and Coffey Evelyn
Home Financials for this Owner
Home Financials are based on the most recent Mortgage that was taken out on this home.
Original Mortgage
$38,700
Interest Rate
8.25%
Purchase Details
Closed on
Aug 12, 1993
Bought by
White Ernest Nelson and White Ivarene M
Purchase Details
Closed on
Apr 3, 1989
Bought by
Sandridge Cecil W
Purchase Details
Closed on
Feb 13, 1987
Bought by
Mccree Loyd and Willa Mae
Create a Home Valuation Report for This Property
The Home Valuation Report is an in-depth analysis detailing your home's value as well as a comparison with similar homes in the area
Home Values in the Area
Average Home Value in this Area
Purchase History
| Date | Buyer | Sale Price | Title Company |
|---|---|---|---|
| Wilson Jimmy | $90,000 | Security Title | |
| Barber Kent S | $35,000 | -- | |
| Coffey Robert E | $56,500 | -- | |
| White Ernest Nelson | -- | -- | |
| Sandridgebarbara | -- | -- | |
| Sandridge Cecil W | -- | -- | |
| Mccree Loyd | -- | -- |
Source: Public Records
Mortgage History
| Date | Status | Borrower | Loan Amount |
|---|---|---|---|
| Previous Owner | Gilbert Mark A | $36,000 | |
| Previous Owner | Mccree Loyd | $38,700 |
Source: Public Records
Tax History Compared to Growth
Tax History
| Year | Tax Paid | Tax Assessment Tax Assessment Total Assessment is a certain percentage of the fair market value that is determined by local assessors to be the total taxable value of land and additions on the property. | Land | Improvement |
|---|---|---|---|---|
| 2024 | $824 | $34,240 | $2,120 | $32,120 |
| 2023 | $824 | $34,240 | $2,120 | $32,120 |
| 2022 | $824 | $34,240 | $2,120 | $32,120 |
| 2021 | $687 | $20,280 | $2,120 | $18,160 |
| 2020 | $687 | $20,280 | $2,120 | $18,160 |
| 2019 | $573 | $20,280 | $2,120 | $18,160 |
| 2018 | $687 | $20,280 | $2,120 | $18,160 |
| 2017 | $687 | $20,280 | $2,120 | $18,160 |
| 2016 | $742 | $20,960 | $2,000 | $18,960 |
| 2015 | $700 | $20,960 | $2,000 | $18,960 |
| 2014 | $700 | $20,964 | $0 | $0 |
Source: Public Records
Map
Nearby Homes
- 604 E Jefferson St
- 207 N Cedar Ln
- 113 N Ingram St
- 538 E Madison St
- 513 E Washington St Unit 513/515
- 513 E Washington St Unit 515
- 927 E Jefferson St
- 520 E Woodring St
- 606 Maple St
- 0 Marietta St
- 403 Victoria St
- 534 E College St
- 221 Pine St
- 547 E College St
- 557 Culpepper St
- 339 E Washington St
- 402 Pine St Unit A/B
- 402 Pine St
- 630 Marietta St
- 437 E College St
- 630 E Jefferson St Unit 632
- 626 E Jefferson St
- 622 E Jefferson St
- 642 E Jefferson St
- 650 E Jefferson St
- 616 E Jefferson St
- 631 E Washington St
- 627 E Jefferson St
- 635 E Jefferson St
- 617 E Jefferson St
- 623 E Jefferson St
- 639 E Jefferson St
- 645 E Washington St
- 643 E Jefferson St
- 654 E Jefferson St
- 615 E Washington St
- 613 E Jefferson St
- 649 E Jefferson St
- 203 N Cedar Ln
- 222 Locust St