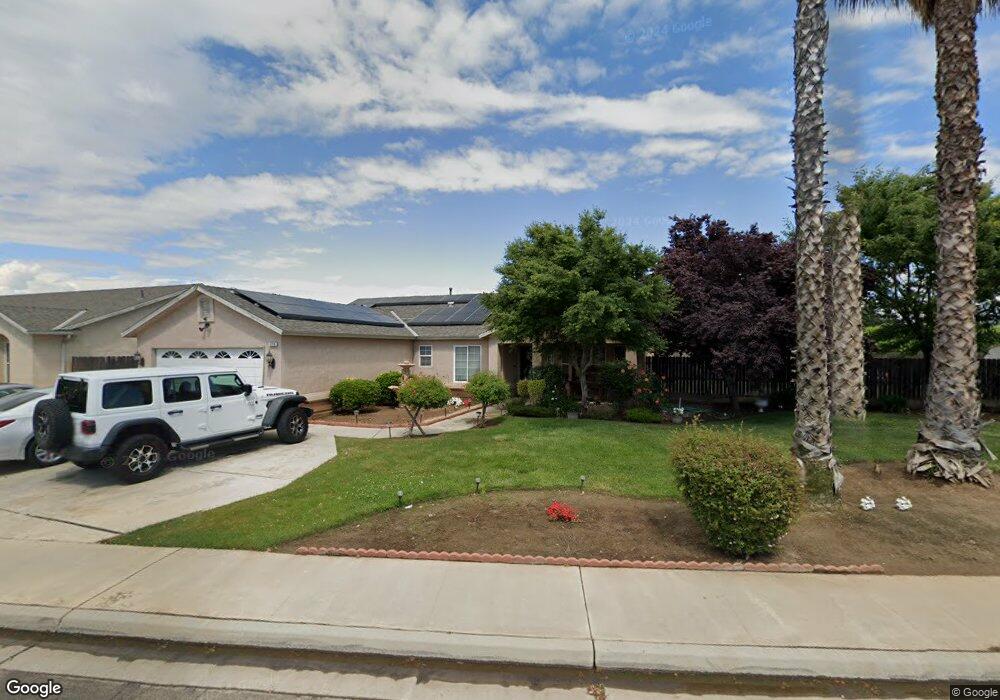
630 Quality Ave Sanger, CA 93657
Estimated Value: $378,000 - $388,000
4
Beds
2
Baths
1,627
Sq Ft
$236/Sq Ft
Est. Value
About This Home
This home is located at 630 Quality Ave, Sanger, CA 93657 and is currently estimated at $384,663, approximately $236 per square foot. 630 Quality Ave is a home located in Fresno County with nearby schools including Wilson Elementary School, Washington Academic Middle School, and Sanger High School.
Ownership History
Date
Name
Owned For
Owner Type
Purchase Details
Closed on
Mar 24, 2022
Sold by
Thi Montano Ngan Kim
Bought by
Montano Ngan Kim Thi
Current Estimated Value
Home Financials for this Owner
Home Financials are based on the most recent Mortgage that was taken out on this home.
Original Mortgage
$209,000
Outstanding Balance
$169,865
Interest Rate
3.63%
Mortgage Type
New Conventional
Estimated Equity
$214,798
Purchase Details
Closed on
Aug 20, 2004
Sold by
Mission Development 5084
Bought by
Pham Ngan Kim
Home Financials for this Owner
Home Financials are based on the most recent Mortgage that was taken out on this home.
Original Mortgage
$153,555
Interest Rate
5.95%
Mortgage Type
FHA
Create a Home Valuation Report for This Property
The Home Valuation Report is an in-depth analysis detailing your home's value as well as a comparison with similar homes in the area
Home Values in the Area
Average Home Value in this Area
Purchase History
| Date | Buyer | Sale Price | Title Company |
|---|---|---|---|
| Montano Ngan Kim Thi | -- | Chicago Title | |
| Pham Ngan Kim | $156,000 | Financial Title Company |
Source: Public Records
Mortgage History
| Date | Status | Borrower | Loan Amount |
|---|---|---|---|
| Open | Montano Ngan Kim Thi | $209,000 | |
| Previous Owner | Pham Ngan Kim | $153,555 | |
| Closed | Pham Ngan Kim | $4,671 |
Source: Public Records
Tax History
| Year | Tax Paid | Tax Assessment Tax Assessment Total Assessment is a certain percentage of the fair market value that is determined by local assessors to be the total taxable value of land and additions on the property. | Land | Improvement |
|---|---|---|---|---|
| 2025 | $2,667 | $216,733 | $41,807 | $174,926 |
| 2023 | $2,495 | $208,320 | $40,185 | $168,135 |
| 2022 | $2,455 | $204,237 | $39,398 | $164,839 |
| 2021 | $2,434 | $200,233 | $38,626 | $161,607 |
| 2020 | $2,362 | $198,180 | $38,230 | $159,950 |
| 2019 | $2,313 | $194,295 | $37,481 | $156,814 |
| 2018 | $2,215 | $190,487 | $36,747 | $153,740 |
| 2017 | $2,176 | $186,753 | $36,027 | $150,726 |
| 2016 | $1,836 | $165,000 | $35,000 | $130,000 |
| 2015 | $1,464 | $129,500 | $24,100 | $105,400 |
| 2014 | $1,376 | $121,300 | $22,600 | $98,700 |
Source: Public Records
Map
Nearby Homes
- 525 Tucker Ave
- 913 Harriett Ave
- 424 Morton Ave
- 658 Rebeca Ave
- 531 K St
- 720 L St
- 983 Church Ave
- 426 L St
- 1240 J St
- 123 Florence Avenue at Pearl Ave
- 521 O St
- 1428 J St
- 85 Acacia Dr
- 1407 Academy Ave
- 3670 S Newmark Ave
- 3680 S Newmark Ave
- 1312 P St
- 0 E Annadale Ave Unit W. of S. Riverbend A
- 824 Hoag Ave
- 836 S Academy Ave
Your Personal Tour Guide
Ask me questions while you tour the home.