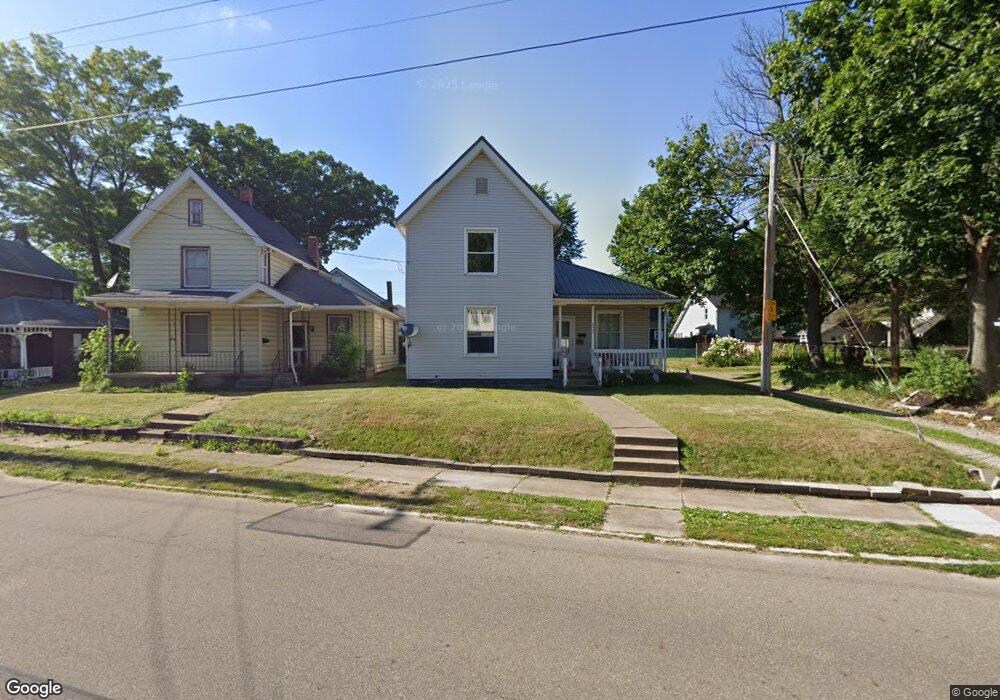
630 Walnut Rd SW Massillon, OH 44647
West Massillon NeighborhoodEstimated Value: $97,814 - $128,000
2
Beds
1
Bath
1,296
Sq Ft
$89/Sq Ft
Est. Value
About This Home
This home is located at 630 Walnut Rd SW, Massillon, OH 44647 and is currently estimated at $115,454, approximately $89 per square foot. 630 Walnut Rd SW is a home located in Stark County with nearby schools including Massillon Intermediate School, Massillon Junior High School, and Washington High School.
Ownership History
Date
Name
Owned For
Owner Type
Purchase Details
Closed on
Jul 26, 1996
Sold by
Steele Wayne L
Bought by
Hartman Paul F and Hartman Lindi
Current Estimated Value
Home Financials for this Owner
Home Financials are based on the most recent Mortgage that was taken out on this home.
Original Mortgage
$29,600
Outstanding Balance
$2,143
Interest Rate
7.25%
Mortgage Type
New Conventional
Estimated Equity
$113,311
Purchase Details
Closed on
Jan 31, 1994
Create a Home Valuation Report for This Property
The Home Valuation Report is an in-depth analysis detailing your home's value as well as a comparison with similar homes in the area
Home Values in the Area
Average Home Value in this Area
Purchase History
| Date | Buyer | Sale Price | Title Company |
|---|---|---|---|
| Hartman Paul F | $37,000 | -- | |
| -- | $12,500 | -- |
Source: Public Records
Mortgage History
| Date | Status | Borrower | Loan Amount |
|---|---|---|---|
| Open | Hartman Paul F | $29,600 |
Source: Public Records
Tax History Compared to Growth
Tax History
| Year | Tax Paid | Tax Assessment Tax Assessment Total Assessment is a certain percentage of the fair market value that is determined by local assessors to be the total taxable value of land and additions on the property. | Land | Improvement |
|---|---|---|---|---|
| 2025 | -- | $28,710 | $7,250 | $21,460 |
| 2024 | -- | $28,710 | $7,250 | $21,460 |
| 2023 | $1,046 | $19,890 | $6,060 | $13,830 |
| 2022 | $1,050 | $19,890 | $6,060 | $13,830 |
| 2021 | $1,067 | $19,890 | $6,060 | $13,830 |
| 2020 | $910 | $15,960 | $4,970 | $10,990 |
| 2019 | $892 | $15,960 | $4,970 | $10,990 |
| 2018 | $892 | $15,960 | $4,970 | $10,990 |
| 2017 | $841 | $14,040 | $3,920 | $10,120 |
| 2016 | $855 | $14,040 | $3,920 | $10,120 |
| 2015 | $845 | $14,040 | $3,920 | $10,120 |
| 2014 | $845 | $13,580 | $3,780 | $9,800 |
| 2013 | $426 | $13,580 | $3,780 | $9,800 |
Source: Public Records
Map
Nearby Homes
- 504 5th St SW
- 532 4th St SW
- 827 9th St SW
- 533 Webb Ave SW
- 718 Bebb Ave SW
- 878 Liberty Ct SW
- 1104 4th St SW
- 17 Maple Ave SE
- 315 14th St SW
- 202 Rose Ave SE
- 3414 Joyce Ave NW Unit 18
- Lot 42 Joyce Ave NW
- 3447 Marys Way Ave NW
- 3476 Joyce Ave NW Unit 15
- 1301 Lincoln Way NW
- 101 14th St NW
- 309 15th St NW
- 313 2nd St NE
- 620 1st St NW
- 56 5th St SE
- 632 Walnut Rd SW
- 631 Perry Ave SW
- 621 Perry Ave SW
- 620 Walnut Rd SW
- 638 Walnut Rd SW
- 617 Perry Ave SW
- 611 6th St SW
- 617 6th St SW
- 606 7th St SW
- 625 Walnut Rd SW
- 705 7th St SW
- 623 6th St SW
- 605 6th St SW
- 626 Perry Ave SW
- 620 Perry Ave SW
- 538 7th St SW
- 627 6th St SW
- 621 Walnut Rd SW
- 712 7th St SW
- 715 Walnut Rd SW