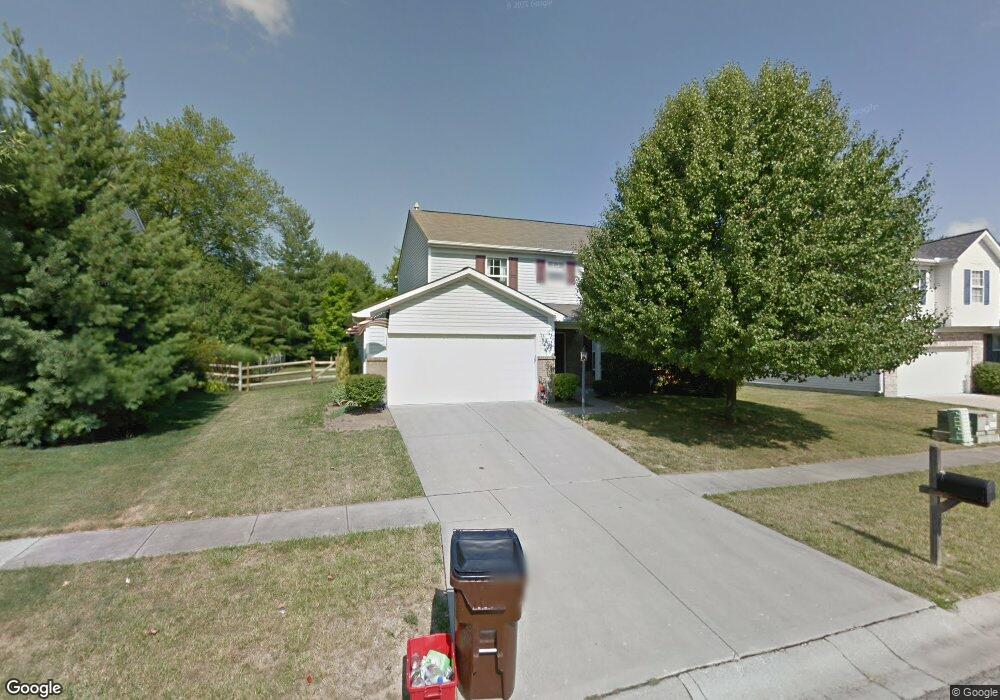
6301 Maple Grove Morrow, OH 45152
Estimated Value: $330,000 - $388,000
4
Beds
3
Baths
1,648
Sq Ft
$212/Sq Ft
Est. Value
About This Home
This home is located at 6301 Maple Grove, Morrow, OH 45152 and is currently estimated at $349,212, approximately $211 per square foot. 6301 Maple Grove is a home located in Warren County with nearby schools including Little Miami Early Childhood Center, Little Miami Intermediate Middle School, and Little Miami Middle School.
Ownership History
Date
Name
Owned For
Owner Type
Purchase Details
Closed on
Jul 2, 2015
Sold by
Nester David B and Nester Amber R
Bought by
Nester Amber R
Current Estimated Value
Purchase Details
Closed on
Apr 4, 2011
Sold by
Cirone Margaret and Williams Margaret S
Bought by
Nester David B and Nester Amber R
Home Financials for this Owner
Home Financials are based on the most recent Mortgage that was taken out on this home.
Original Mortgage
$115,983
Outstanding Balance
$78,374
Interest Rate
4.75%
Mortgage Type
FHA
Estimated Equity
$270,838
Purchase Details
Closed on
Jan 26, 2000
Sold by
Ryland Group Inc
Bought by
Williams Margaret S
Home Financials for this Owner
Home Financials are based on the most recent Mortgage that was taken out on this home.
Original Mortgage
$136,750
Interest Rate
7.84%
Mortgage Type
FHA
Create a Home Valuation Report for This Property
The Home Valuation Report is an in-depth analysis detailing your home's value as well as a comparison with similar homes in the area
Home Values in the Area
Average Home Value in this Area
Purchase History
| Date | Buyer | Sale Price | Title Company |
|---|---|---|---|
| Nester Amber R | -- | Attorney | |
| Nester David B | $119,000 | Central States Title Agency | |
| Williams Margaret S | $137,900 | -- |
Source: Public Records
Mortgage History
| Date | Status | Borrower | Loan Amount |
|---|---|---|---|
| Open | Nester David B | $115,983 | |
| Closed | Williams Margaret S | $136,750 |
Source: Public Records
Tax History
| Year | Tax Paid | Tax Assessment Tax Assessment Total Assessment is a certain percentage of the fair market value that is determined by local assessors to be the total taxable value of land and additions on the property. | Land | Improvement |
|---|---|---|---|---|
| 2025 | $3,677 | $82,860 | $28,000 | $54,860 |
| 2024 | $3,677 | $82,860 | $28,000 | $54,860 |
| 2023 | $3,065 | $61,614 | $12,915 | $48,699 |
| 2022 | $3,029 | $61,614 | $12,915 | $48,699 |
| 2021 | $2,888 | $61,614 | $12,915 | $48,699 |
| 2020 | $2,750 | $50,092 | $10,500 | $39,592 |
| 2019 | $2,796 | $50,092 | $10,500 | $39,592 |
| 2018 | $2,729 | $50,092 | $10,500 | $39,592 |
| 2017 | $2,261 | $41,559 | $9,177 | $32,382 |
| 2016 | $2,315 | $41,559 | $9,177 | $32,382 |
| 2015 | $2,314 | $41,559 | $9,177 | $32,382 |
| 2014 | $2,619 | $41,560 | $9,180 | $32,380 |
| 2013 | $2,566 | $47,550 | $10,500 | $37,050 |
Source: Public Records
Map
Nearby Homes
- 668 Thornton Dr
- 704 Oak Forest Dr
- 723 Grande Oaks Dr
- 310 Red Cedar Ct
- 873 E US Highway 22 and 3
- 873 U S 22
- 5805 Turning Leaf Way
- 6046 Driftwood Ct
- 6250 Avebury Ct
- 151 Arbor Glen Ct
- 5670 Beechtree Ln
- 477 Auburn Grove Dr
- 553 Auburn Grove Dr
- 1327 Chelsea Ct
- 222 Indian Lake Dr
- 122 Deere Run Ln
- 5172 Williams Ridge Dr
- 920 Pondside Ln
- 0 Deere Run Ln Unit 1836428
- 466 Stephens Rd
- 6289 Maple Grove
- 6313 Maple Grove
- 6325 Maple Grove
- 6275 Maple Grove
- 6304 Maple Grove
- 6290 Maple Grove
- 6316 Maple Grove
- 6263 Maple Grove
- 6337 Maple Grove
- 6278 Maple Grove
- 6266 Maple Grove
- 6251 Maple Grove
- 6244 Winding Way
- 6258 Winding Way
- 6340 Maple Grove
- 6349 Maple Grove
- 6250 Maple Grove
- 6274 Winding Way
- 6237 Maple Grove
- 6352 Maple Grove
Your Personal Tour Guide
Ask me questions while you tour the home.