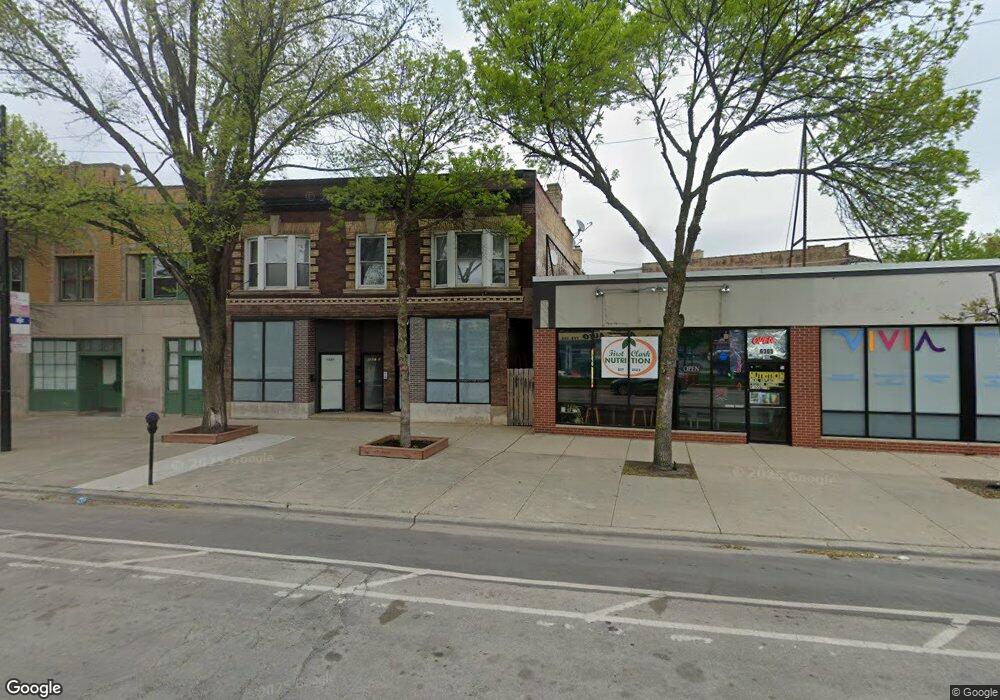
6307 N Clark St Unit 1N Chicago, IL 60660
Edgewater NeighborhoodEstimated Value: $677,000 - $854,000
--
Bed
3
Baths
--
Sq Ft
3,485
Sq Ft Lot
About This Home
This home is located at 6307 N Clark St Unit 1N, Chicago, IL 60660 and is currently estimated at $751,834. 6307 N Clark St Unit 1N is a home located in Cook County with nearby schools including Hayt Elementary School, Senn High School, and Northside Catholic Academy.
Ownership History
Date
Name
Owned For
Owner Type
Purchase Details
Closed on
Mar 28, 2016
Sold by
Chicago Title Land Trust Co
Bought by
Belmonte Ventures Llc
Current Estimated Value
Purchase Details
Closed on
Jun 9, 2014
Sold by
Jamal Akram and Jamal Farhana
Bought by
Chicago Title Land Trust #8002364778
Purchase Details
Closed on
Apr 21, 2005
Sold by
Broadway Bank
Bought by
Jamal Akram and Jamal Amir
Home Financials for this Owner
Home Financials are based on the most recent Mortgage that was taken out on this home.
Original Mortgage
$540,000
Interest Rate
6.13%
Mortgage Type
Seller Take Back
Purchase Details
Closed on
Mar 30, 1999
Sold by
American National Bk & Tr Co Of Chicago
Bought by
Sarantos Nick and Sarantos Christine
Home Financials for this Owner
Home Financials are based on the most recent Mortgage that was taken out on this home.
Original Mortgage
$35,000
Interest Rate
7.06%
Mortgage Type
Credit Line Revolving
Create a Home Valuation Report for This Property
The Home Valuation Report is an in-depth analysis detailing your home's value as well as a comparison with similar homes in the area
Home Values in the Area
Average Home Value in this Area
Purchase History
| Date | Buyer | Sale Price | Title Company |
|---|---|---|---|
| Belmonte Ventures Llc | $475,000 | Chicago Title | |
| Chicago Title Land Trust #8002364778 | $200,000 | Multiple | |
| Jamal Akram | -- | -- | |
| Broadway Bank | $540,000 | -- | |
| Sarantos Nick | -- | -- |
Source: Public Records
Mortgage History
| Date | Status | Borrower | Loan Amount |
|---|---|---|---|
| Previous Owner | Jamal Akram | $540,000 | |
| Previous Owner | Sarantos Nick | $35,000 |
Source: Public Records
Tax History Compared to Growth
Tax History
| Year | Tax Paid | Tax Assessment Tax Assessment Total Assessment is a certain percentage of the fair market value that is determined by local assessors to be the total taxable value of land and additions on the property. | Land | Improvement |
|---|---|---|---|---|
| 2024 | $11,393 | $74,000 | $34,745 | $39,255 |
| 2023 | $11,107 | $54,000 | $27,936 | $26,064 |
| 2022 | $11,107 | $54,000 | $27,936 | $26,064 |
| 2021 | $10,859 | $54,000 | $27,936 | $26,064 |
| 2020 | $11,790 | $52,925 | $16,063 | $36,862 |
| 2019 | $12,083 | $60,142 | $16,063 | $44,079 |
| 2018 | $12,842 | $65,011 | $16,063 | $48,948 |
| 2017 | $10,225 | $47,500 | $13,968 | $33,532 |
| 2016 | $9,514 | $47,500 | $13,968 | $33,532 |
| 2015 | $9,840 | $53,699 | $13,968 | $39,731 |
| 2014 | $9,389 | $50,605 | $10,476 | $40,129 |
| 2013 | $9,204 | $50,605 | $10,476 | $40,129 |
Source: Public Records
Map
Nearby Homes
- 1542 W Highland Ave
- 1626 W Highland Ave Unit 1W
- 1513 W Highland Ave
- 6414 N Paulina St Unit G
- 6321 N Hermitage Ave
- 6421 N Greenview Ave Unit 2W
- 1457 W Rosemont Ave Unit G
- 1723 W Thome Ave
- 1762 W Highland Ave Unit 104
- 1435 W Arthur Ave Unit 1
- 1748 W Granville Ave Unit 2A
- 6532 N Ashland Ave
- 6447 N Glenwood Ave
- 6220 N Ridge Ave Unit S307
- 6220 N Ridge Ave Unit S203
- 6065 N Hermitage Ave
- 7518 N Ridge Ave Unit 1E
- 1331 W Granville Ave
- 6129 N Ravenswood Ave
- 1823 W Granville Ave Unit 4A
- 6307 N Clark St
- 6307 N Clark St
- 6311 N Clark St
- 6315 N Clark St
- 6317 N Clark St
- 1540 W Rosemont Ave
- 6321 N Clark St
- 6309 N Clark St Unit 1
- 1549 W Highland Ave Unit 2
- 1547 W Highland Ave Unit 3
- 1547 W Highland Ave
- 1547 W Highland Ave Unit 3
- 1547 W Highland Ave Unit 1
- 1547 W Highland Ave Unit 2
- 1547 W Highland Ave Unit G
- 1538 W Rosemont Ave Unit 2W
- 1538 W Rosemont Ave Unit 1W
- 6323 N Clark St
- 6323 N Clark St Unit 2
- 1536 W Rosemont Ave