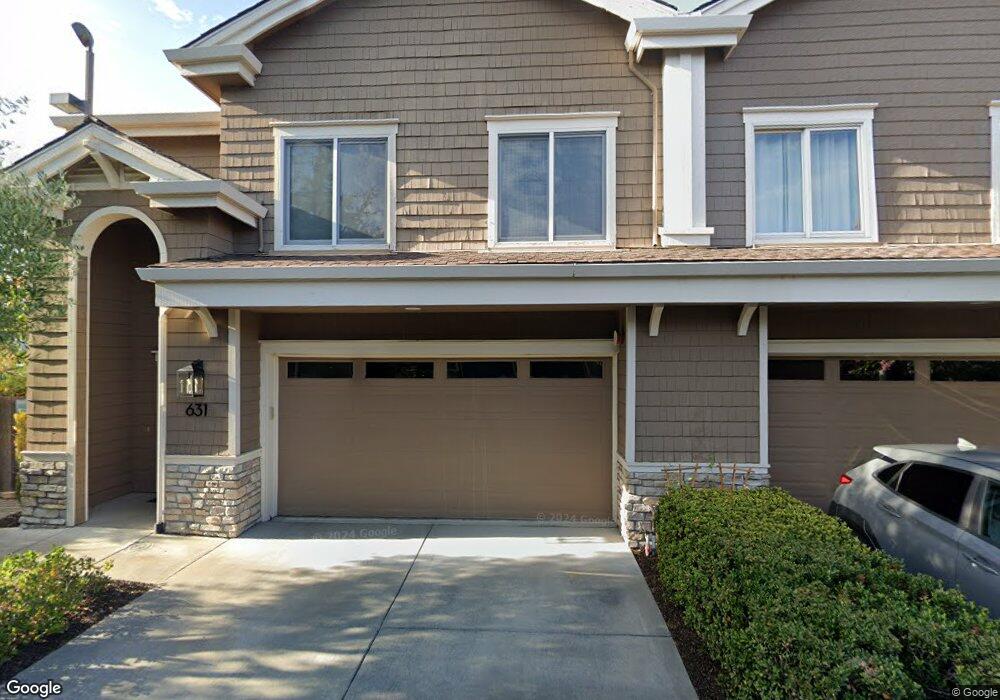
631 1st St W Sonoma, CA 95476
Estimated Value: $896,000 - $1,270,000
3
Beds
3
Baths
2,045
Sq Ft
$495/Sq Ft
Est. Value
About This Home
This home is located at 631 1st St W, Sonoma, CA 95476 and is currently estimated at $1,012,410, approximately $495 per square foot. 631 1st St W is a home located in Sonoma County with nearby schools including Prestwood Elementary School, Adele Harrison Middle School, and Creekside High School.
Ownership History
Date
Name
Owned For
Owner Type
Purchase Details
Closed on
Mar 25, 2011
Sold by
Med & G Group Lp
Bought by
Flageollet James G
Current Estimated Value
Home Financials for this Owner
Home Financials are based on the most recent Mortgage that was taken out on this home.
Original Mortgage
$292,250
Outstanding Balance
$185,654
Interest Rate
3.25%
Mortgage Type
New Conventional
Estimated Equity
$826,756
Purchase Details
Closed on
Jul 6, 2010
Sold by
Hevia Nancy
Bought by
Med & G Group Lp
Purchase Details
Closed on
Jul 30, 2005
Sold by
Nuzum Charles and Bellah Judith
Bought by
Nuzum Charles and Bellah Judith
Purchase Details
Closed on
Jan 26, 2005
Sold by
623 First Street West J/V Llc
Bought by
Hevia Nancy
Home Financials for this Owner
Home Financials are based on the most recent Mortgage that was taken out on this home.
Original Mortgage
$591,200
Interest Rate
1%
Mortgage Type
Purchase Money Mortgage
Create a Home Valuation Report for This Property
The Home Valuation Report is an in-depth analysis detailing your home's value as well as a comparison with similar homes in the area
Home Values in the Area
Average Home Value in this Area
Purchase History
| Date | Buyer | Sale Price | Title Company |
|---|---|---|---|
| Flageollet James G | $417,500 | Fidelity National Title Co | |
| Med & G Group Lp | $341,500 | None Available | |
| Nuzum Charles | -- | -- | |
| Hevia Nancy | $739,000 | Old Republic Title Company |
Source: Public Records
Mortgage History
| Date | Status | Borrower | Loan Amount |
|---|---|---|---|
| Open | Flageollet James G | $292,250 | |
| Previous Owner | Hevia Nancy | $591,200 | |
| Closed | Hevia Nancy | $73,900 |
Source: Public Records
Tax History
| Year | Tax Paid | Tax Assessment Tax Assessment Total Assessment is a certain percentage of the fair market value that is determined by local assessors to be the total taxable value of land and additions on the property. | Land | Improvement |
|---|---|---|---|---|
| 2025 | $7,221 | $534,880 | $172,952 | $361,928 |
| 2024 | $7,221 | $524,393 | $169,561 | $354,832 |
| 2023 | $7,221 | $514,112 | $166,237 | $347,875 |
| 2022 | $6,921 | $504,032 | $162,978 | $341,054 |
| 2021 | $6,838 | $494,150 | $159,783 | $334,367 |
| 2020 | $6,727 | $489,084 | $158,145 | $330,939 |
| 2019 | $6,575 | $479,495 | $155,045 | $324,450 |
| 2018 | $6,404 | $470,094 | $152,005 | $318,089 |
| 2017 | $6,279 | $460,877 | $149,025 | $311,852 |
| 2016 | $6,045 | $451,841 | $146,103 | $305,738 |
| 2015 | -- | $445,055 | $143,909 | $301,146 |
| 2014 | -- | $436,338 | $141,091 | $295,247 |
Source: Public Records
Map
Nearby Homes
- 629 1st St W
- 627 1st St W
- 633 1st St W
- 625 1st St W
- 637 1st St W
- 639 1st St W
- 623 1st St W
- 641 1st St W
- 621 1st St W
- 649 1st Street Unkn Unit 19
- 643 1st St W
- 579 1st St W Unit 561 A
- 579 1st St W
- 617 1st St W
- 619 1st St W
- 645 1st St W Unit C
- 645 1st St W Unit A
- 645 1st St W Unit D
- 599 1st St W
- 649 1st St W Unit 31
Your Personal Tour Guide
Ask me questions while you tour the home.