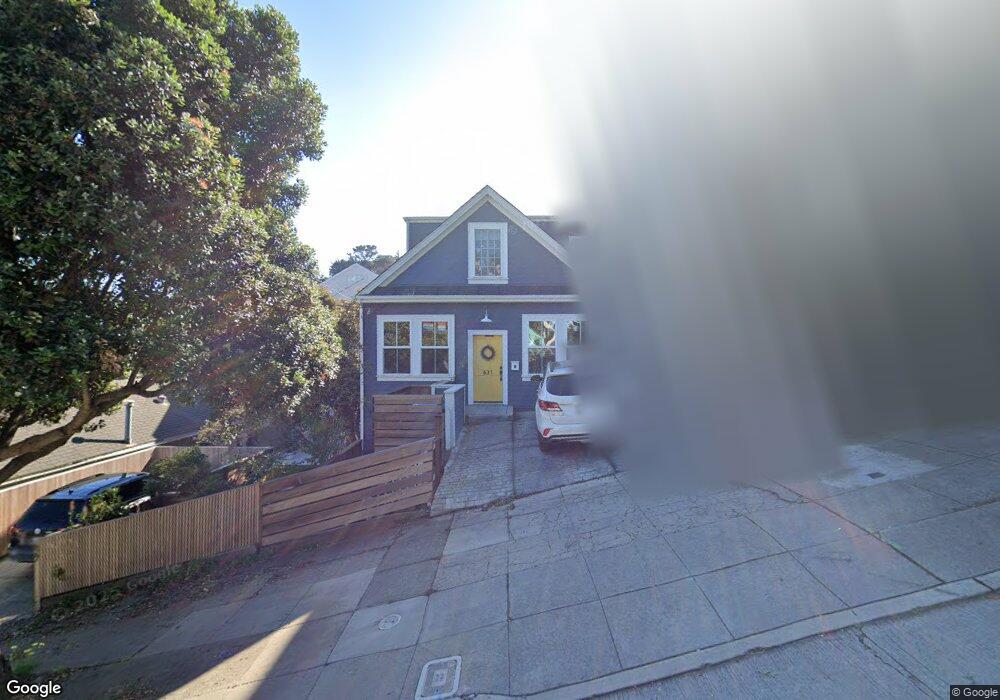
631 29th St San Francisco, CA 94131
Noe Valley NeighborhoodEstimated Value: $1,224,000 - $2,001,000
3
Beds
1
Bath
1,083
Sq Ft
$1,564/Sq Ft
Est. Value
About This Home
This home is located at 631 29th St, San Francisco, CA 94131 and is currently estimated at $1,694,038, approximately $1,564 per square foot. 631 29th St is a home located in San Francisco County with nearby schools including Glen Park Elementary School, James Lick Middle School, and St. Philip School.
Ownership History
Date
Name
Owned For
Owner Type
Purchase Details
Closed on
Jan 25, 2021
Sold by
Rhee Margaret Kim and Winoto Adrian
Bought by
Winoto Adrian and Rhee Margaret Kim
Current Estimated Value
Home Financials for this Owner
Home Financials are based on the most recent Mortgage that was taken out on this home.
Original Mortgage
$896,860
Outstanding Balance
$800,750
Interest Rate
2.6%
Mortgage Type
New Conventional
Estimated Equity
$893,288
Purchase Details
Closed on
Jan 25, 2017
Sold by
Winoto Adrian and Rhee Margaret
Bought by
Winoto Adrian and Rhee Margaret Kim
Purchase Details
Closed on
Nov 23, 2009
Sold by
Hiscox Deborah and Howell Jay
Bought by
Winoto Adrian and Rhee Margaret
Home Financials for this Owner
Home Financials are based on the most recent Mortgage that was taken out on this home.
Original Mortgage
$742,519
Interest Rate
4.99%
Mortgage Type
FHA
Create a Home Valuation Report for This Property
The Home Valuation Report is an in-depth analysis detailing your home's value as well as a comparison with similar homes in the area
Home Values in the Area
Average Home Value in this Area
Purchase History
| Date | Buyer | Sale Price | Title Company |
|---|---|---|---|
| Winoto Adrian | -- | Accommodation | |
| Rhee Margaret Kim | -- | Radian Settlement Svcs Inc | |
| Winoto Adrian | -- | None Available | |
| Winoto Adrian | $756,500 | Chicago Title Company |
Source: Public Records
Mortgage History
| Date | Status | Borrower | Loan Amount |
|---|---|---|---|
| Open | Rhee Margaret Kim | $896,860 | |
| Closed | Winoto Adrian | $742,519 |
Source: Public Records
Tax History Compared to Growth
Tax History
| Year | Tax Paid | Tax Assessment Tax Assessment Total Assessment is a certain percentage of the fair market value that is determined by local assessors to be the total taxable value of land and additions on the property. | Land | Improvement |
|---|---|---|---|---|
| 2025 | $14,643 | $1,204,133 | $683,294 | $520,839 |
| 2024 | $14,643 | $1,180,525 | $669,897 | $510,628 |
| 2023 | $14,374 | $1,157,378 | $656,762 | $500,616 |
| 2022 | $14,088 | $1,134,686 | $643,885 | $490,801 |
| 2021 | $13,837 | $1,112,439 | $631,260 | $481,179 |
| 2020 | $13,904 | $1,101,034 | $624,788 | $476,246 |
| 2019 | $13,428 | $1,079,447 | $612,538 | $466,909 |
| 2018 | $12,977 | $1,058,283 | $600,528 | $457,755 |
| 2017 | $12,525 | $1,037,526 | $588,752 | $448,774 |
| 2016 | $12,316 | $1,017,184 | $577,208 | $439,976 |
| 2015 | $12,163 | $1,001,908 | $568,538 | $433,370 |
| 2014 | $9,659 | $796,284 | $557,402 | $238,882 |
Source: Public Records
Map
Nearby Homes